Divergence
Divergence Pattern
Divergence is when price shows trending moves while the corresponding oscillator shows none
trending move.
It is used with market structure for potential trend continuation or trend reversal. It tells you the
status of momentum of a trend whether going weak or is strong. It is not at all recommended to
use it as the only signal to increase your odds of expectation of a change in direction/trend.
So, divergence patterns occur when the trend is weakening or when there is a weakening of price
retracement. Divergence between price swing and oscillator is an important signal for loss of
momentum in the trend and potential reversal can be expected.
Divergence is measured with the help of oscillators which are momentum indicators used in
technical analysis, whose fluctuations are bound by some upper and lower band.
When oscillator values approach these bands, they provide overbought or oversold signals
to traders.
How do oscillators indicate divergence?
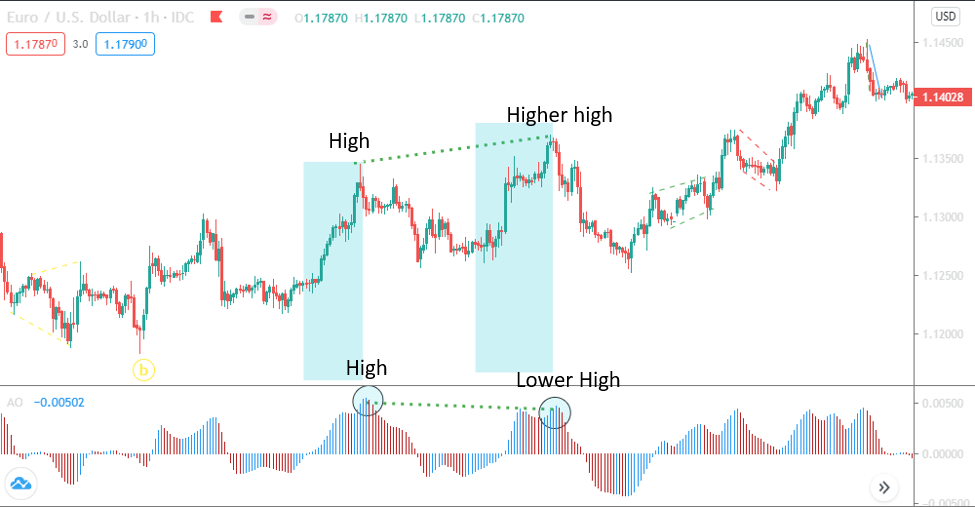
We recommend using “Awesome Oscillator” (AO) to measure divergence. In order to do that we
compare the tops and bottoms of price with the tops and bottoms of the AO. So, if price as shown
in the picture below, is in a uptrend for instance and price is making a higher high compared to the
previous high and the oscillator is showing a lower high compared to the previous peak/high then
there is a divergence and indicates possible weakening of the trend and a possible bigger pullback
or reversal. The blue shaded rectangular area marks the whole of impulsive swing legs and within
this area you mark the corresponding highest peak in the oscillator shown with circles in the
oscillator.
Divergence on higher time frames as well lower at the same time is a better sign to expect trend to
finish and turn or fully reverse.
When to look for Divergence?
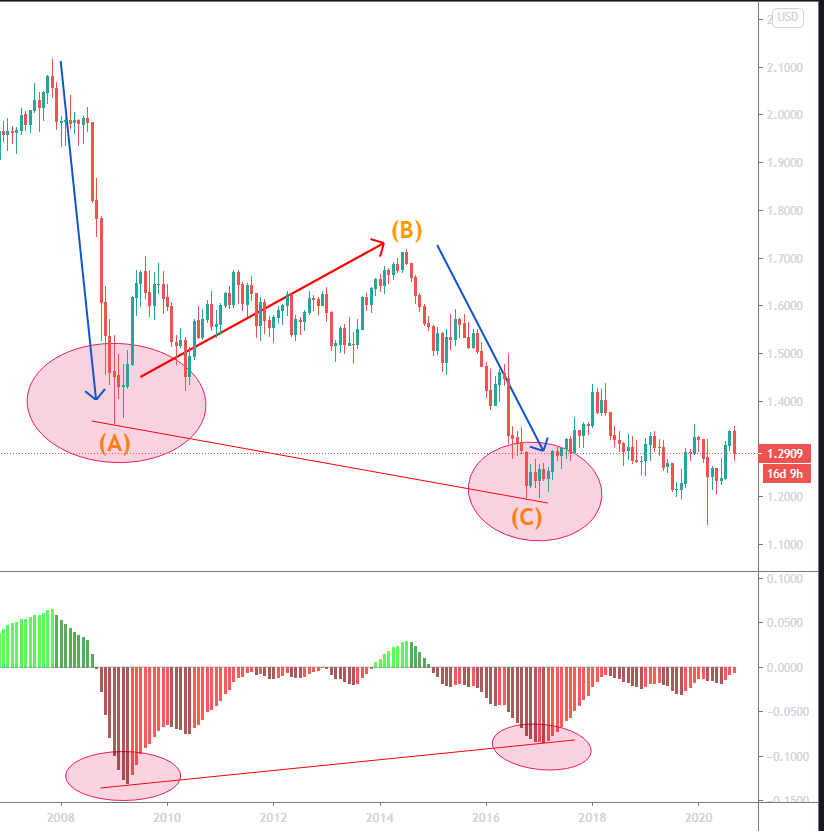
In 3 wave Corrective or Impulsive Pattern, look for divergence between the 2 impulsive waves if
the pattern is Regular as shown below:
In 5 wave Corrective Pattern, look for divergences between the last two Impulsive waves
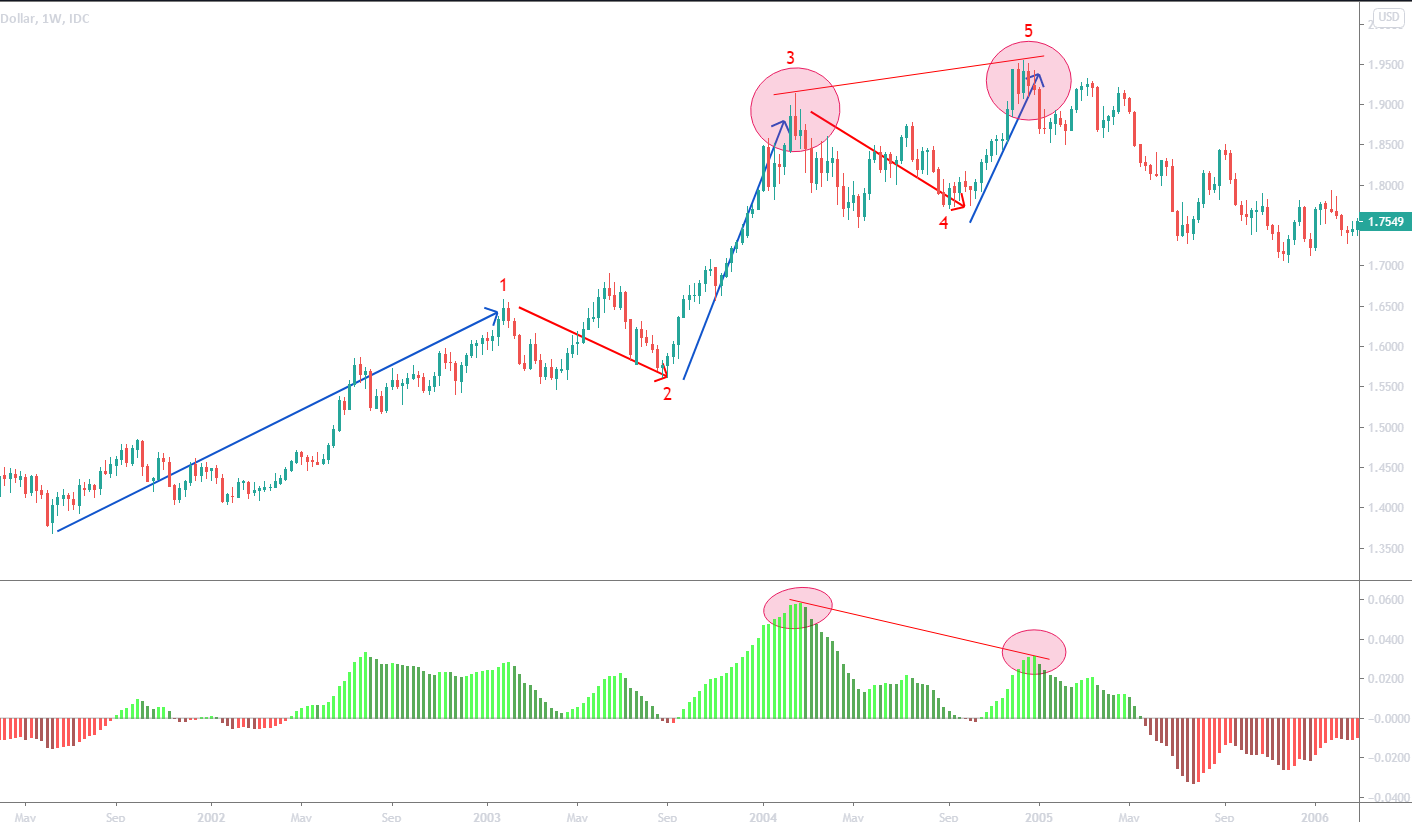
In 5 wave Impulsive Pattern, look for divergence between the last two Impulsive waves, wave 3
and wave 5 as shown below:
Oscillator
The use of oscillator is to identify possible completion of a corrective structure in case of regular
or 5 wave trending correction and also in case of 3 or 5 wave impulsive wave structure.
When there is divergence between the oscillator peaks (in uptrend) / bottoms (in downtrend) and
its corresponding impulsive waves, a possible completion of the structure can be expected.
Divergence indicates loss of momentum in the ongoing trend.
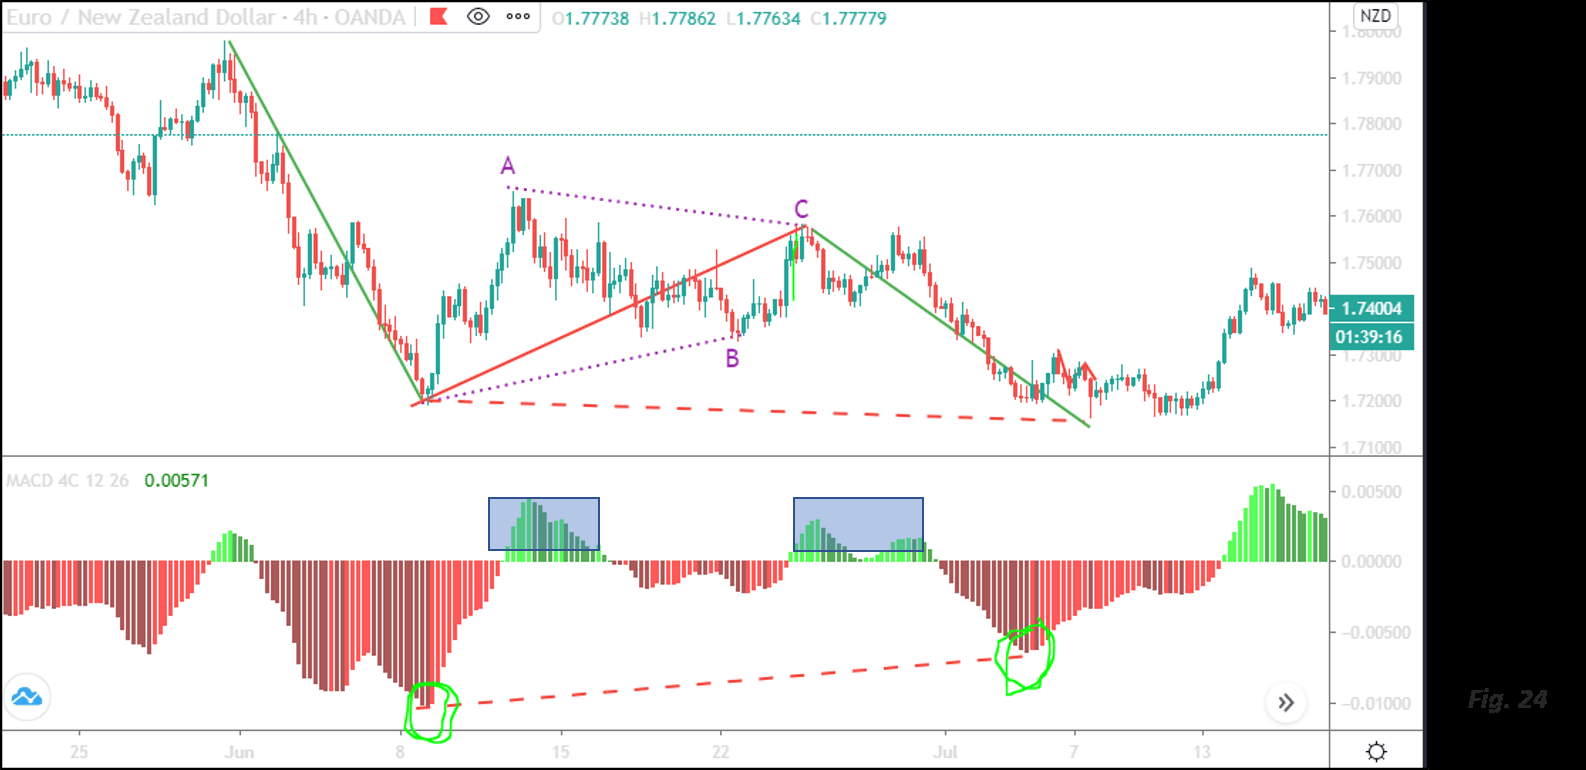
Take the lowest bottom in the oscillator (as shown in green circle in fig. 24 below) that comes
within its corresponding impulsive wave (as shown with green line in the price chart).
There should be at least one crossover in between the two bottoms of the oscillator. (as shown with
blue boxes).
Oscillator is only a tool. In a corrective structure if 3 waves are done and no divergence, it can
mean one more down but doesn’t negate that the corrective structure is done and can also resume
the trend
Images
Comments (0)
- No comments yet.