Trend
Trend
A trend is when the price swings/waves move in one direction. A single swing is not a trend. A
trend consists in two sorts of patterns: Motive and Corrective
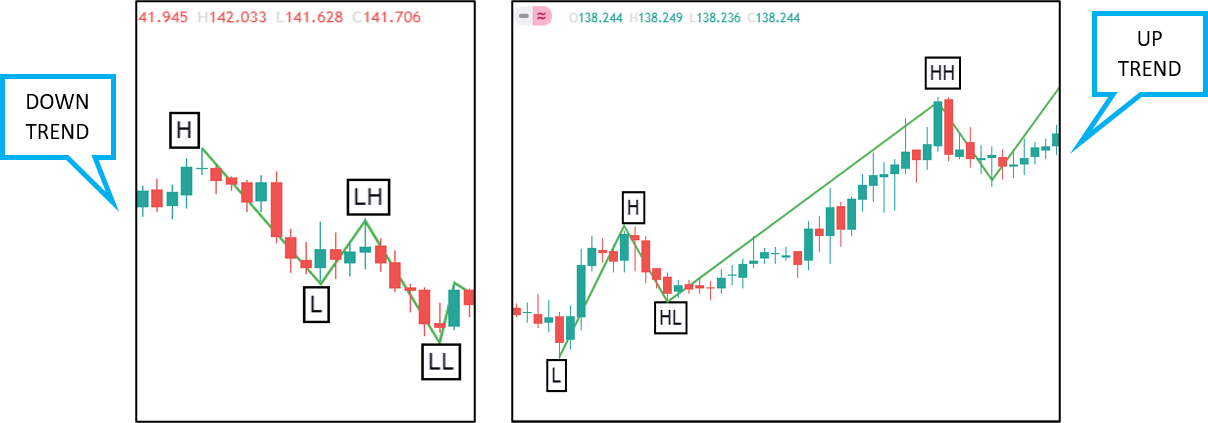
Bull trend (uptrend): a sequence of low (L), high (H), higher low (HL), higher high (HH)
Bear trend (down trend): a sequence of H, L, Lower high (LH), Lower Low (LL)
picture.
However, knowing a trend is not enough if we are to take advantage of it. Knowing the strength or
momentum (Momentum shows the rate of change in price movement over a period) of a trend is an
important part of analysis that has these advantages:
• Good momentum can lead to fast moves so big win.
• Probability of expected direction with the trend is high because a trend doesn’t reverse
easily so chances of getting stopped out is less if the stop loss is planned well after
analyzing the trend.
• Weak trend or weakening momentum can provide trading opportunities for the reversal of
the trend.
How to identify strength of a trend?
• Moving averages are used to analyze if a trend is going strong or weak. A simple moving average
is formed by computing the average price of a security over a specific number of
periods. Learn more about moving average.
It gives idea about strength of the trend, structure and sometimes used as targets for any
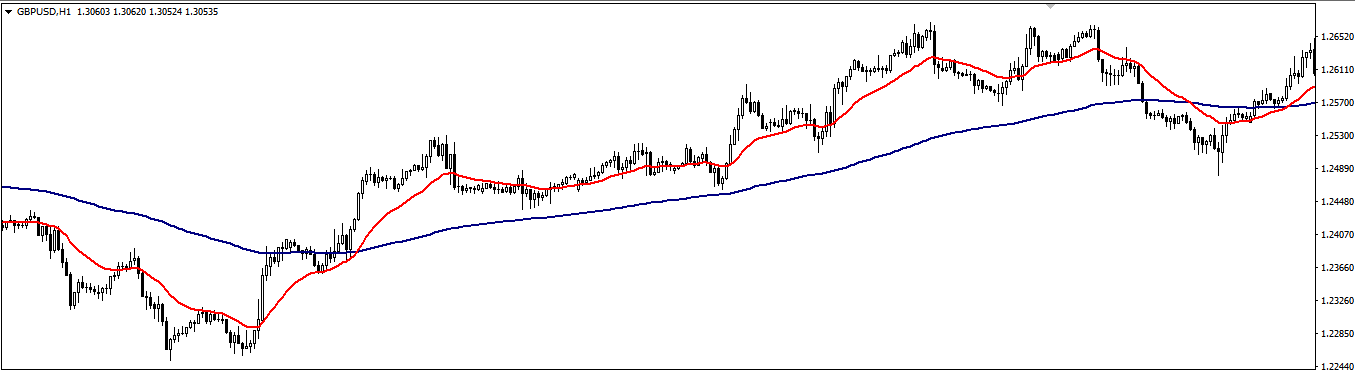
countertrend move. Usually price staying with 20 MA period moving average indicates strong
trend whereas price going near or touching a 200 MA and trending indicates weak or a long-term
trend to be in play. Referring to picture below, 20 MA is above 200 MA and price also above 20
MA indicates a strong trend.
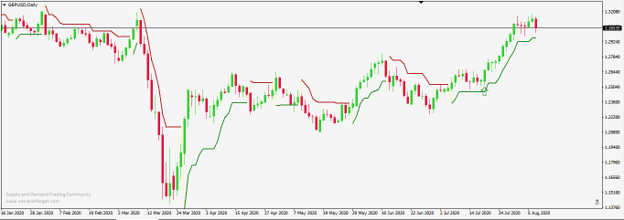
• There is another trend following indicator more or less similar to Moving Averages called
Supertrend. The average true range (ATR) plays an important role in 'Supertrend' as the
indicator uses ATR to calculate its value. The ATR indicator signals the degree of price
volatility.in the chart below the green and red lines is the supertrend indicator. Green
supertrend indicates bullish momentum or bias and red indicates bearish momentum or
bias.
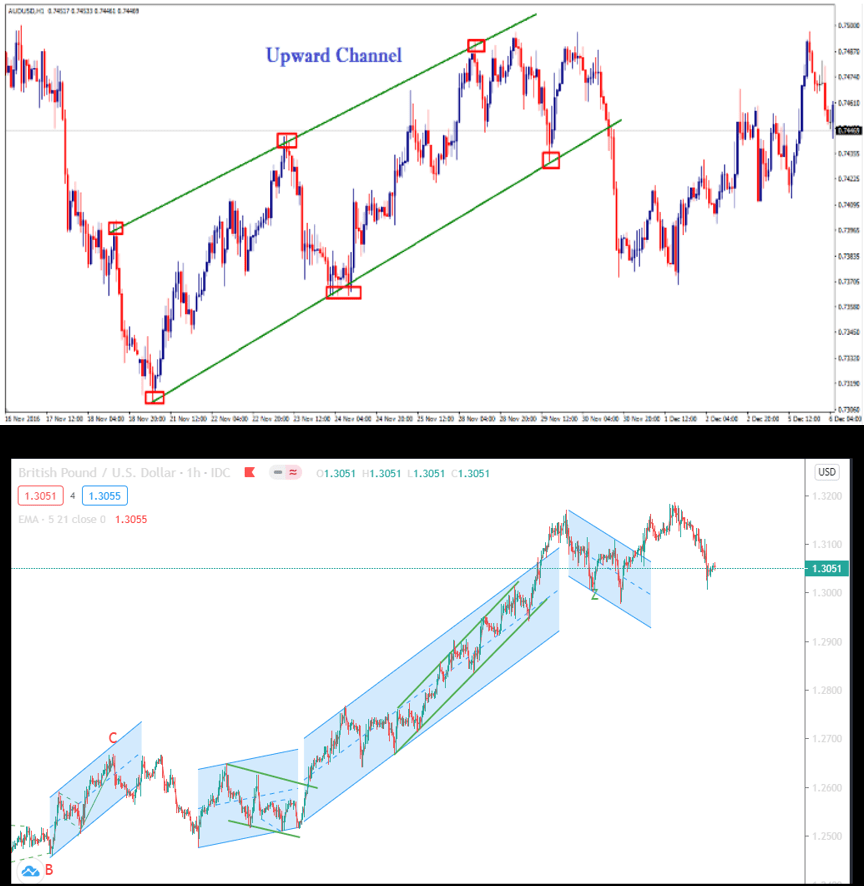
Trend channel used to analyze trend.
A trend is a pattern which means it, in a bull trend, rises then falls (pulls back), less than it rose,
and rises again thus forming an ascending channel. At the pullback times there can be good
opportunities to trade the next rise of the bull trend. A channel helps to see these pull back levels.
However, break of a channel can also signify potential turn in the trend. Analysis of the strength
of the trend is important to be able to use the channel for entries and exits.
Guidelines for drawing channel
• Channel should be sloping in one direction and parallel.
• It is made of 3 touches: two touches in one side of it with one touch, in between the two touches, at
the other side of it. Both trendlines should be parallel to each other
• The angle of a trend channel should be within 25-45 degree. It should constitute of maximum 150-
230 candles.
So, patterns, oscillator (explained in the divergence topic), swings and moving average are some of
the important means to analyze a trend and plan your entry with the trend and even against the
trend.
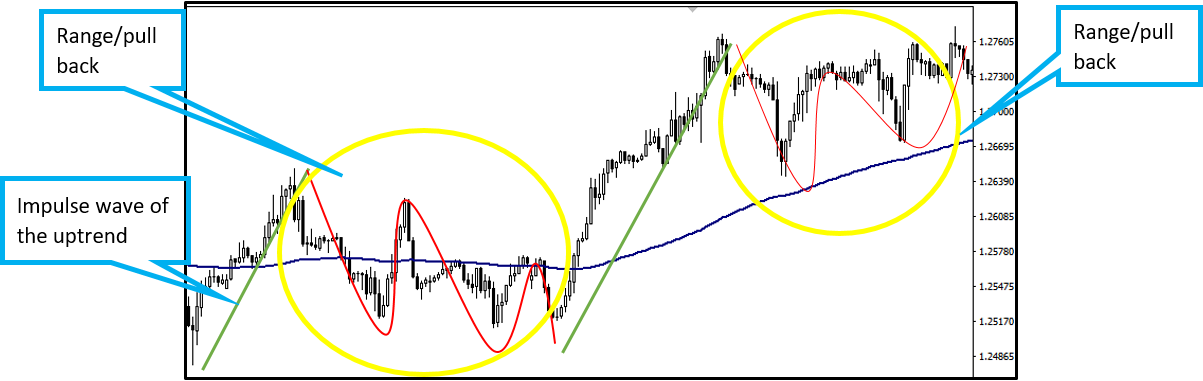
Range or pull backs are correction part of a trend
• These are non-trending movements, sideways and forms a zone within which it keeps moving up
and down
• Price will be swinging up and down of the moving average usually a bigger one like 200 moving
average. Price moves away a bit and then snaps back towards it.
• After a range, price can also reverse the previous trend instead of resuming it. So, analysis of
momentum of the trend, the range pattern, the pattern during break of the range helps to anticipate
the next impulse direction.
• Pullbacks are retracement of the trend. Usually, pullback in a strong trend and after 3rd wave in a
12345 impulse respects 50% fib or 21 or 36 moving average from where it bounces to resume the
trend.
• The below chart shows the pull back or range in the red waves which is happening after an impulse
move up shown by green line. So, after the range, we expect trend to resume.
• Since a trend is a sequence of either up or down, the pullbacks or correction of a trend will not
retrace the corresponding impulsive wave by more than 100% whereas a correction can be a
trending or non-trending pattern.
• Support resistance, channels, moving averages and Fibonacci retracements are some of the tools
used for knowing and trading the pullback levels where the pull back is likely to complete and the
trend resumes.
Since correction and trend both have certain patterns, knowing patterns after knowing the trend
and its strength gives more detailed information for a trader to anticipate the next move and
plan the entry and exit.
Images
Comments (0)
- No comments yet.