Patterns
This lesson covers three related layers of chart patterns: swing (wave) patterns, corrective patterns in their various shapes, and reversal patterns — how to recognize each one and what it tends to signal about direction.
Swing patterns / wave patterns
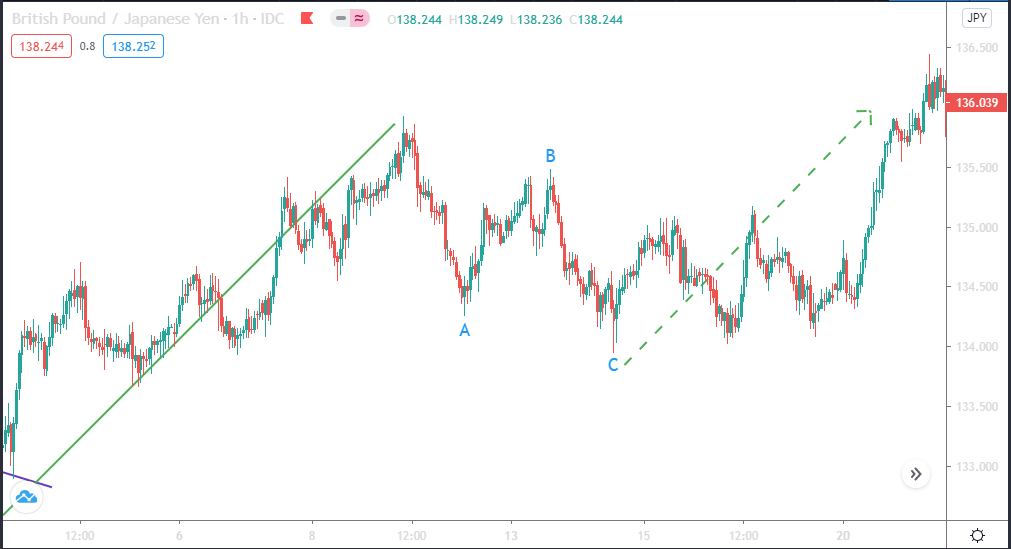
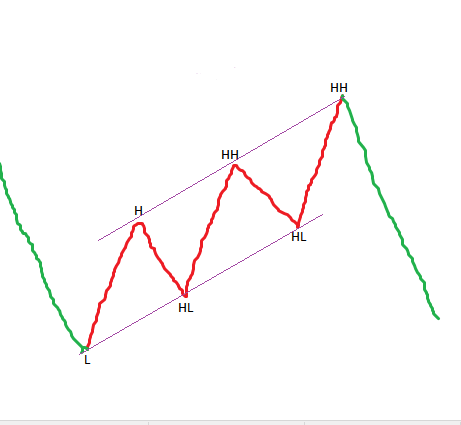
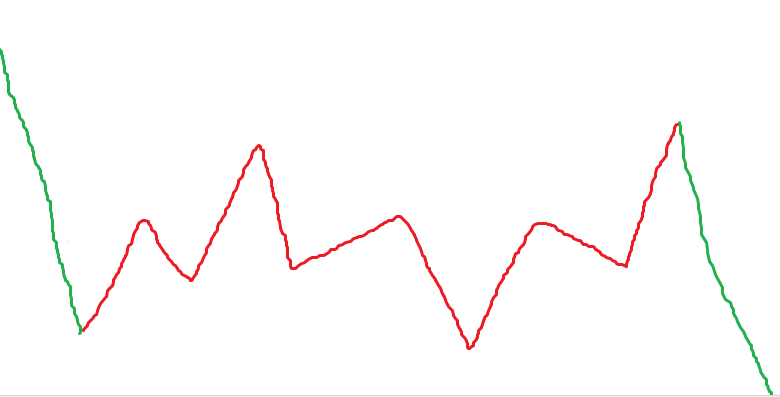
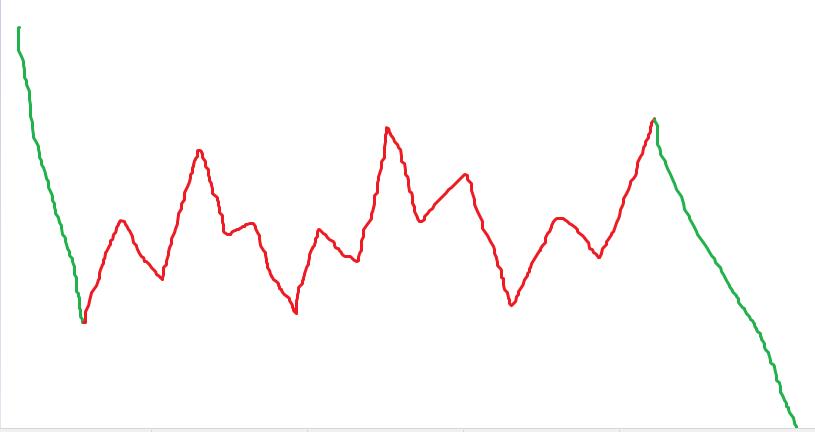
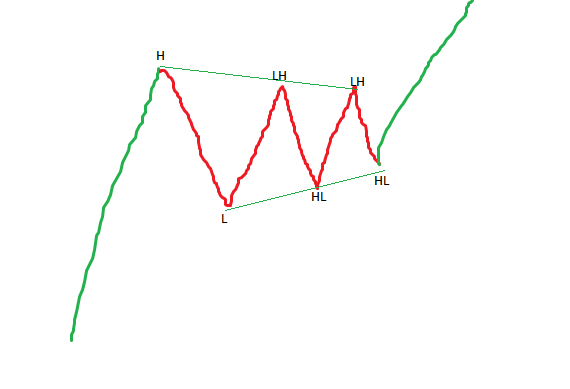
Waves, taken together, form swing patterns. Recognizing them matters for two reasons. First, they help in reading direction and the potential extent of a move, whether that move is a reversal or a continuation of the existing trend. Second, because these patterns are repetitive in nature and form naturally on a chart, recognizing one in progress gives a clearer sense of what to expect next.
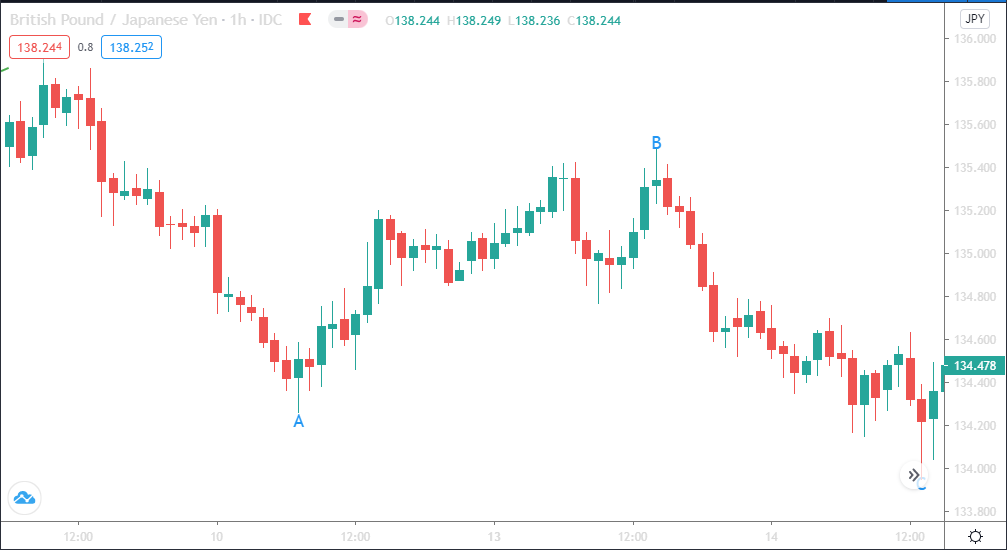
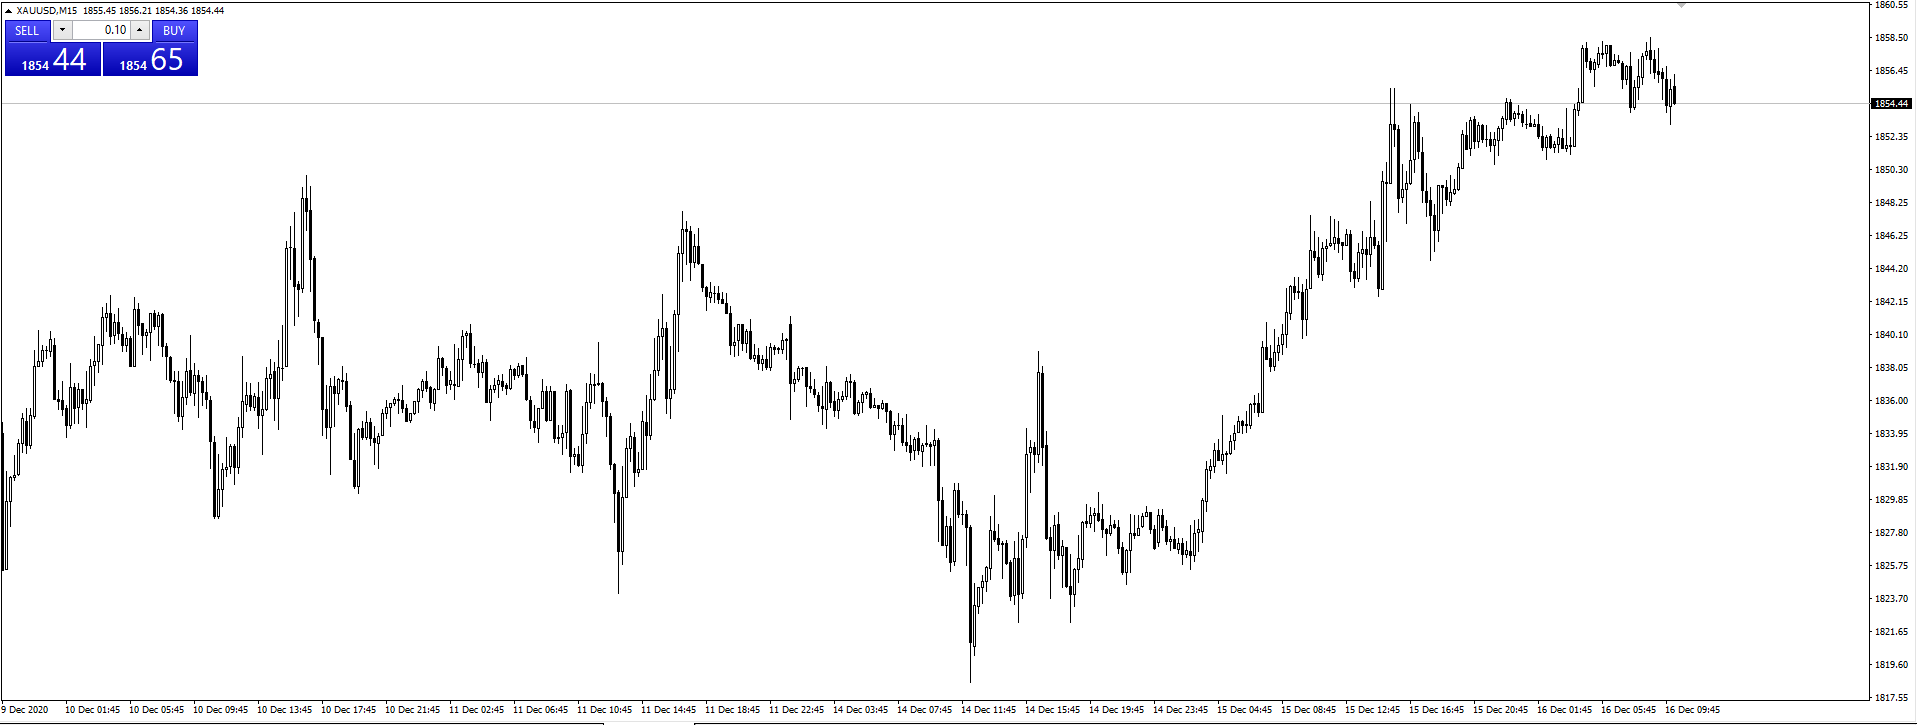
A practical habit for learning to see these patterns: zoom out. A chart zoomed in close often looks like noise, while the same price action zoomed out to see the wave patterns clearly reveals a much more legible structure.
Corrective patterns
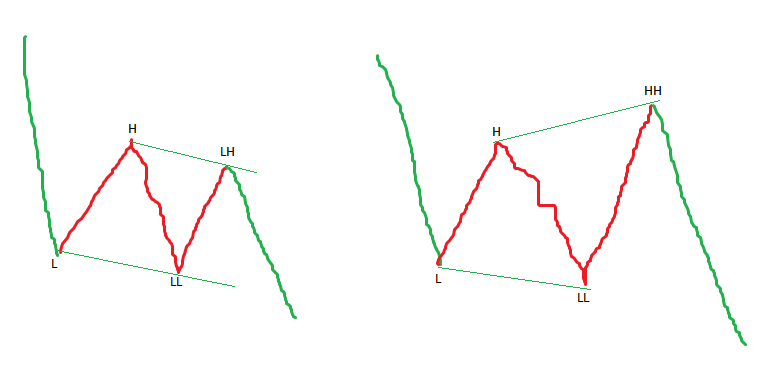
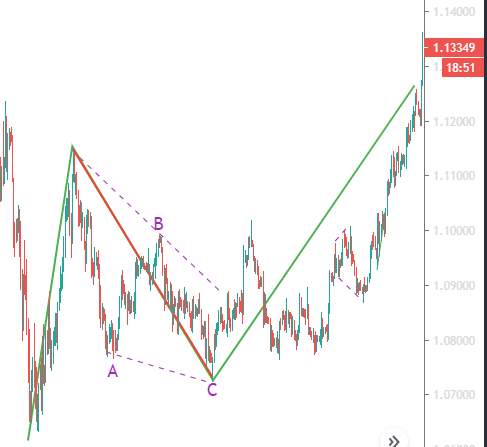
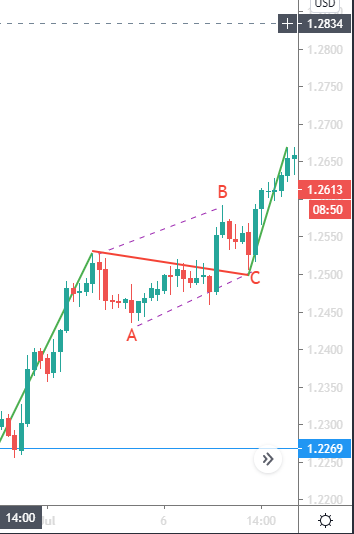
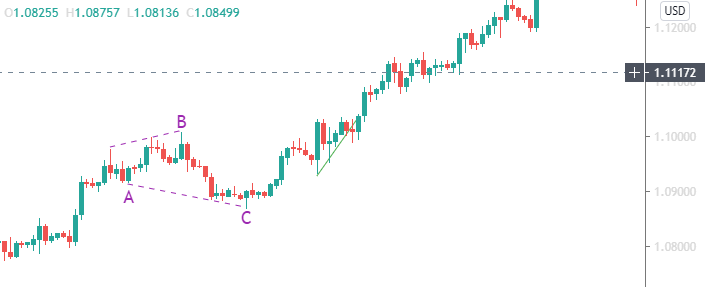
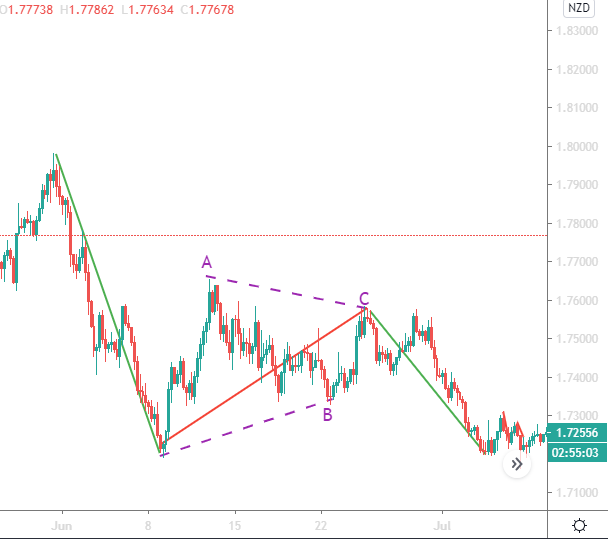
Three-wave corrective patterns (A-B-C). These come in a handful of variants — regular, running, expanding, and contracting — each differing in how far wave B retraces wave A and how far wave C extends beyond it. Seeing real chart examples of each variant side by side is the fastest way to build an eye for telling them apart.
Five-wave corrective patterns. Not every correction resolves in a single three-wave leg. Double three and triple three corrective patterns, along with the closely related WXYXZ structure, are combinations of two or three simple corrective patterns connected by additional three-wave connector legs. In these structures, the connecting legs are themselves corrective while the overall sequence alternates between correction and the connector; recognizing the connector legs is what separates a genuine double or triple three from a single, simpler correction that's merely taking longer to resolve.
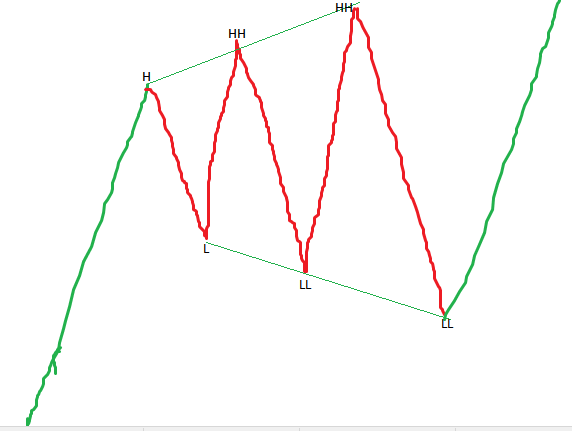
Five-wave non-trending corrective patterns — triangles (A-B-C-D-E). Triangles are five-legged corrective patterns that come in contracting and expanding forms. A contracting triangle narrows leg by leg toward its apex; a chart example of a contracting triangle typically shows the A-B-C-D-E legs converging between two trendlines drawn through the A-C-E points and the B-D points.
Continuation patterns
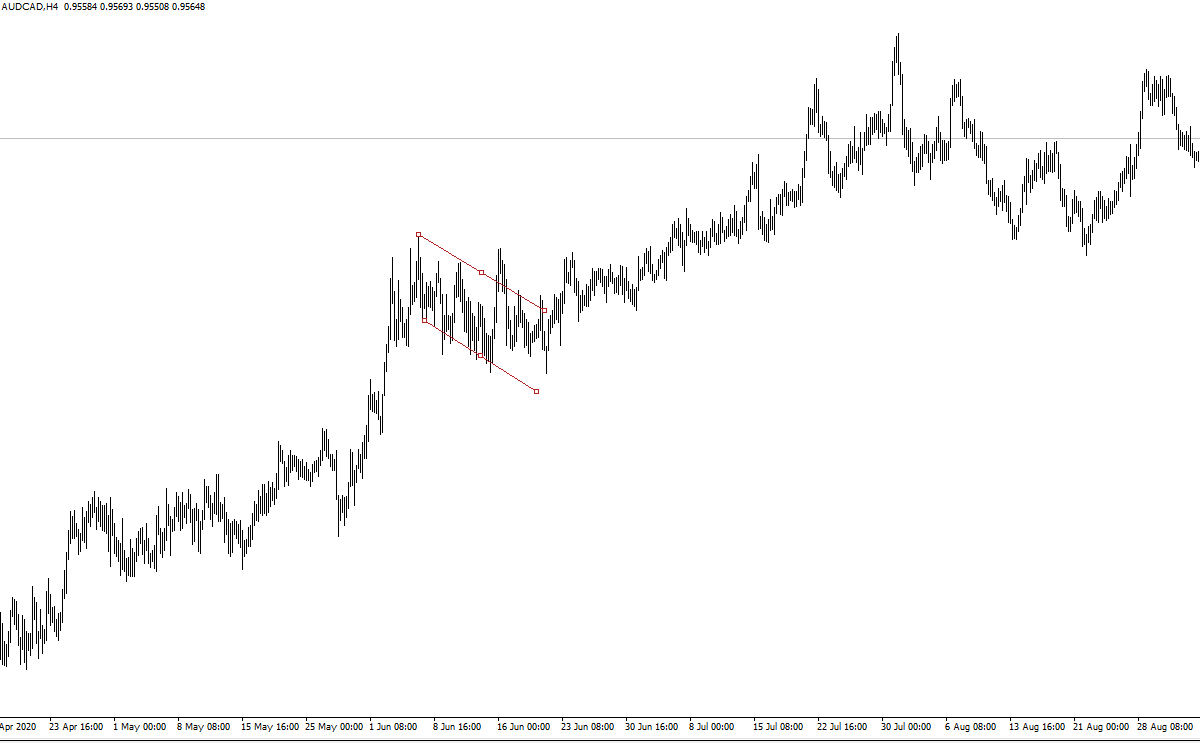
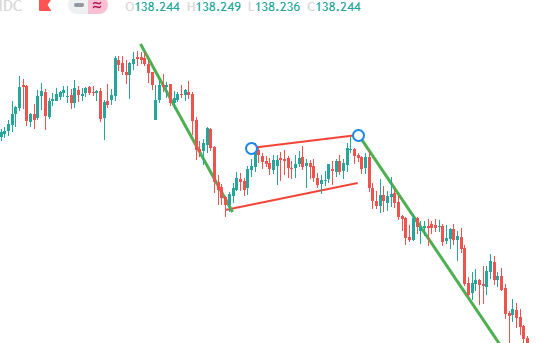
Some corrective patterns resolve back in the direction of the trend that preceded them — these are read as continuation patterns rather than reversal patterns, since the larger trend picks back up once the pattern completes.
Reversal patterns
A handful of well-known chart shapes tend to mark a change from one trend to its opposite:
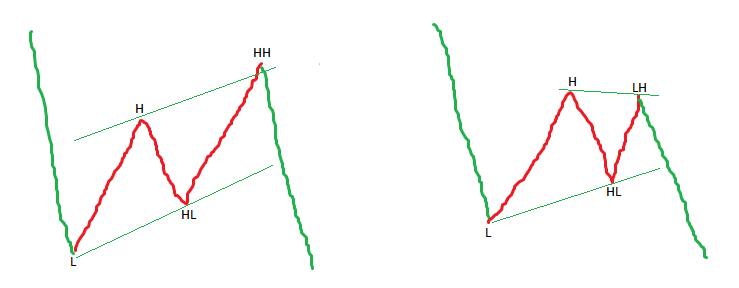
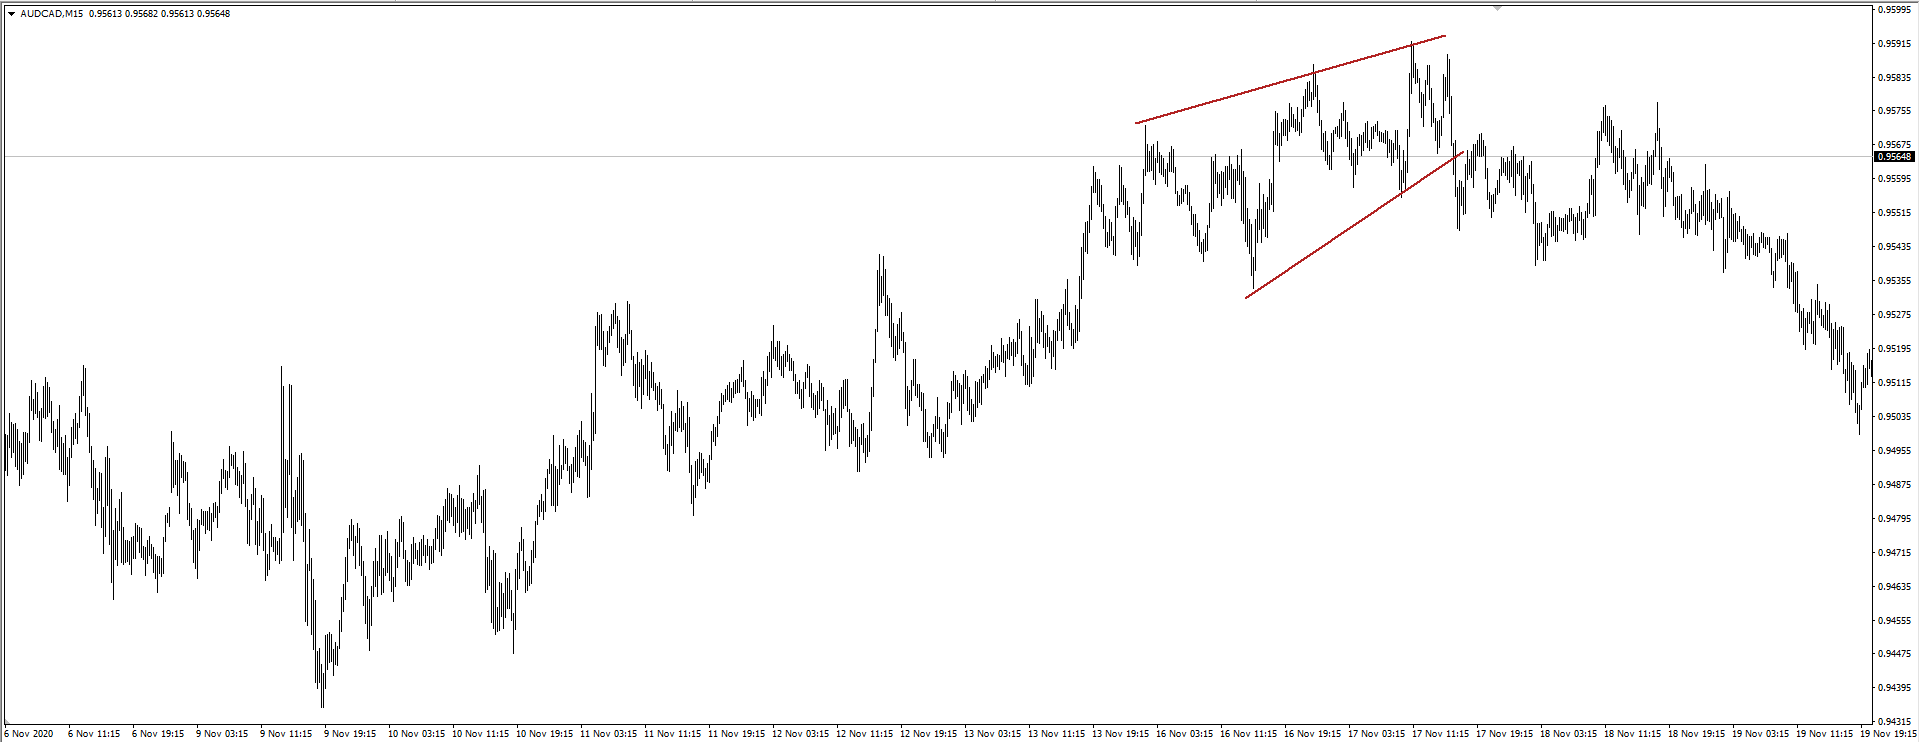
- Rising wedge — a pattern associated with an uptrend reversing into a downtrend.
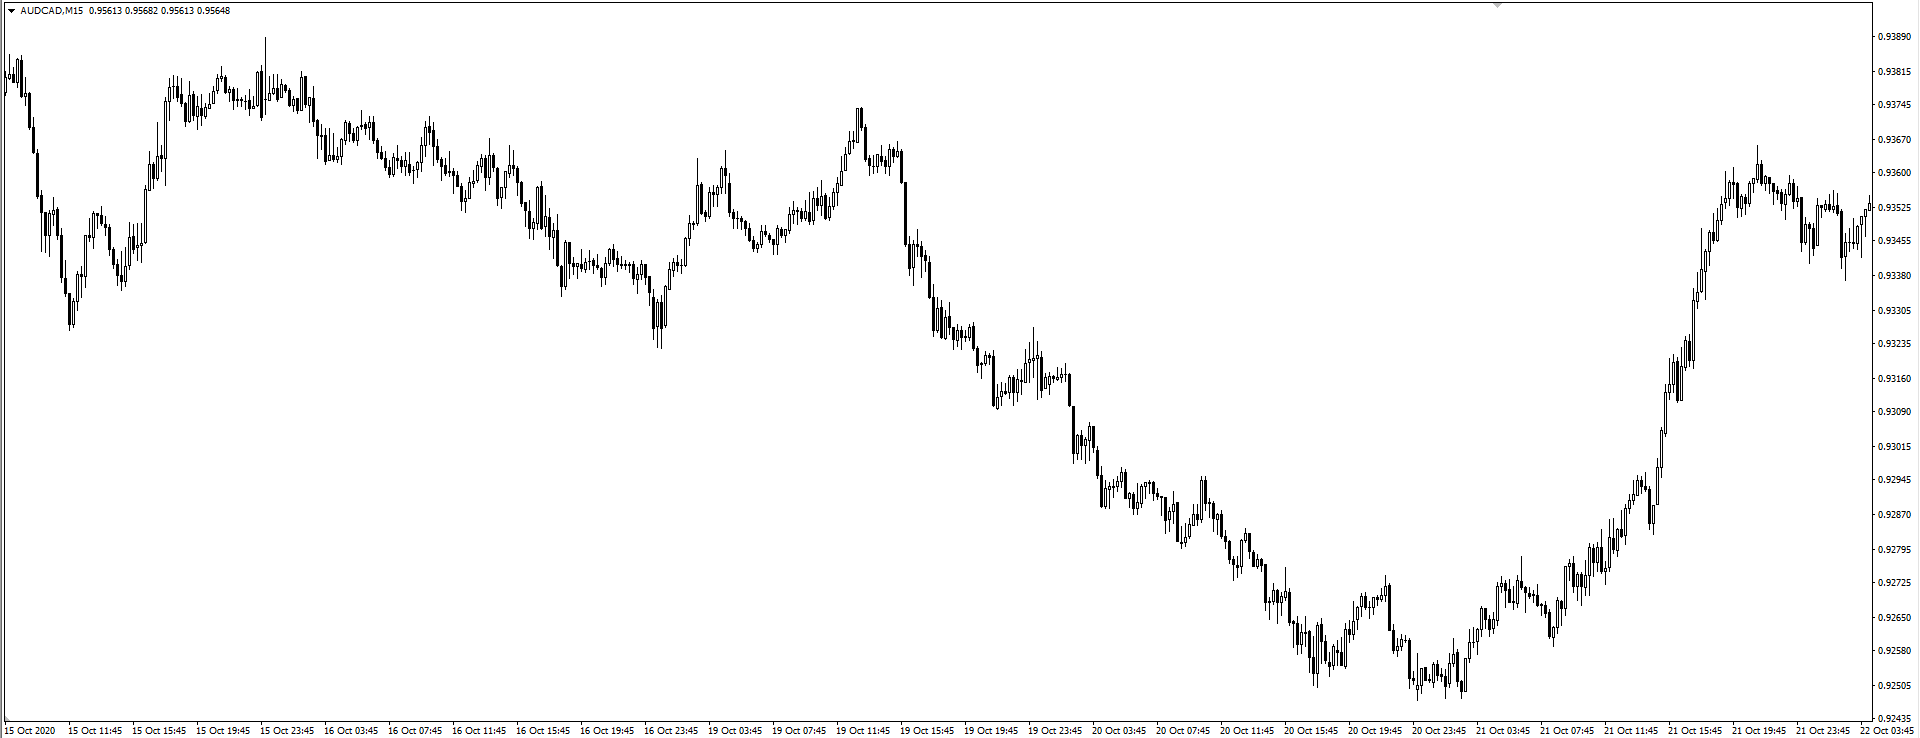
- Double bottom — two comparable lows separated by a peak, associated with a reversal from a downtrend to an uptrend.
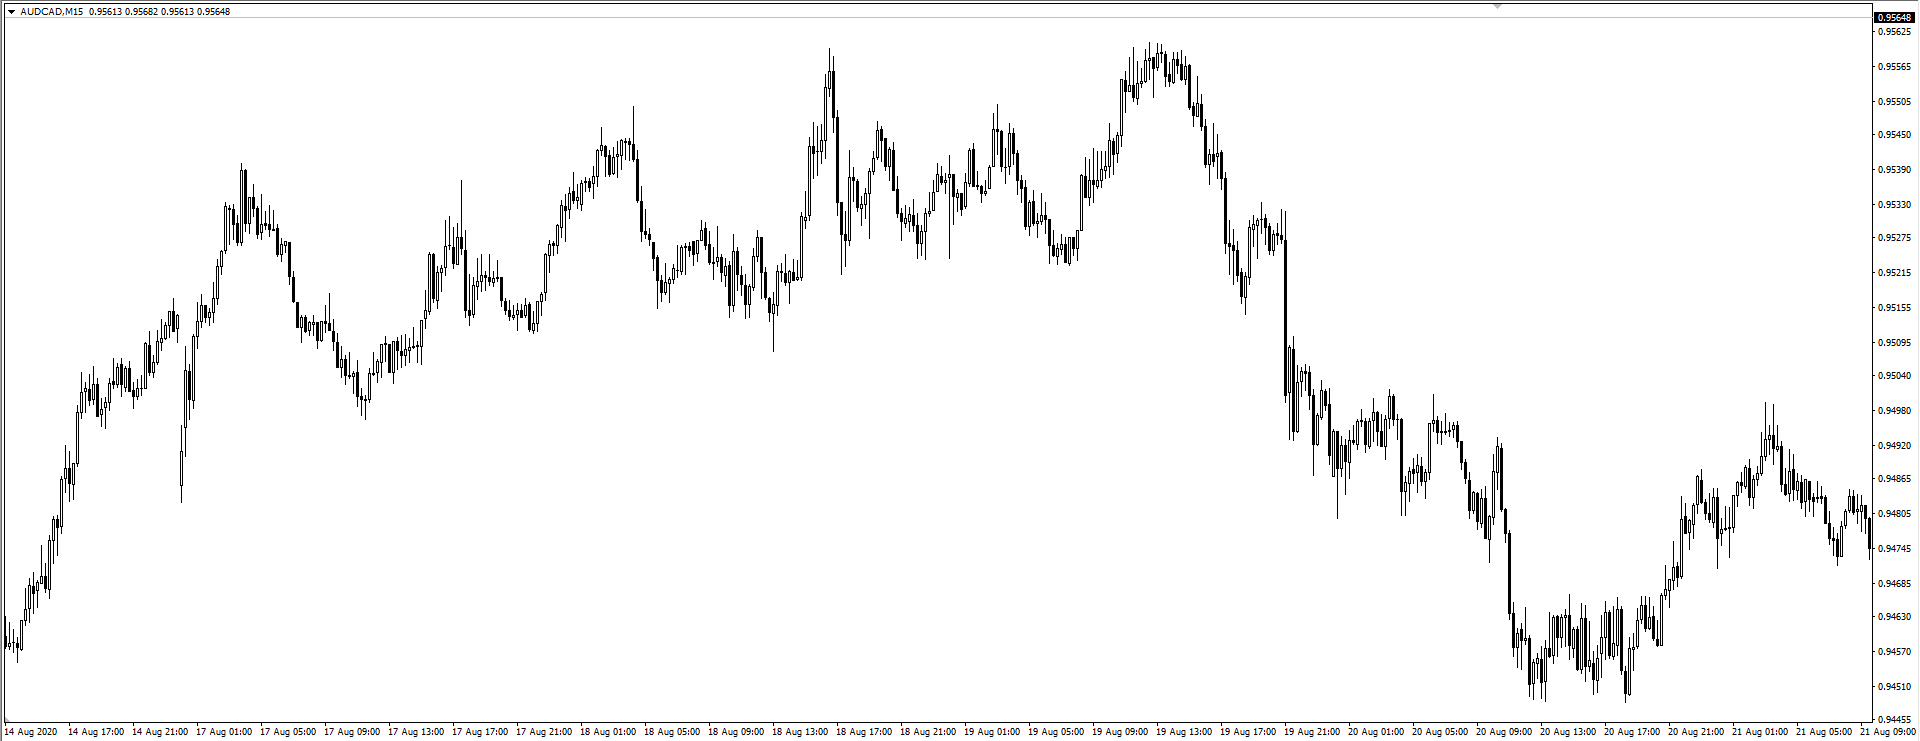
- Double top — two comparable highs separated by a trough, the mirror image of a double bottom, associated with a reversal from an uptrend to a downtrend.
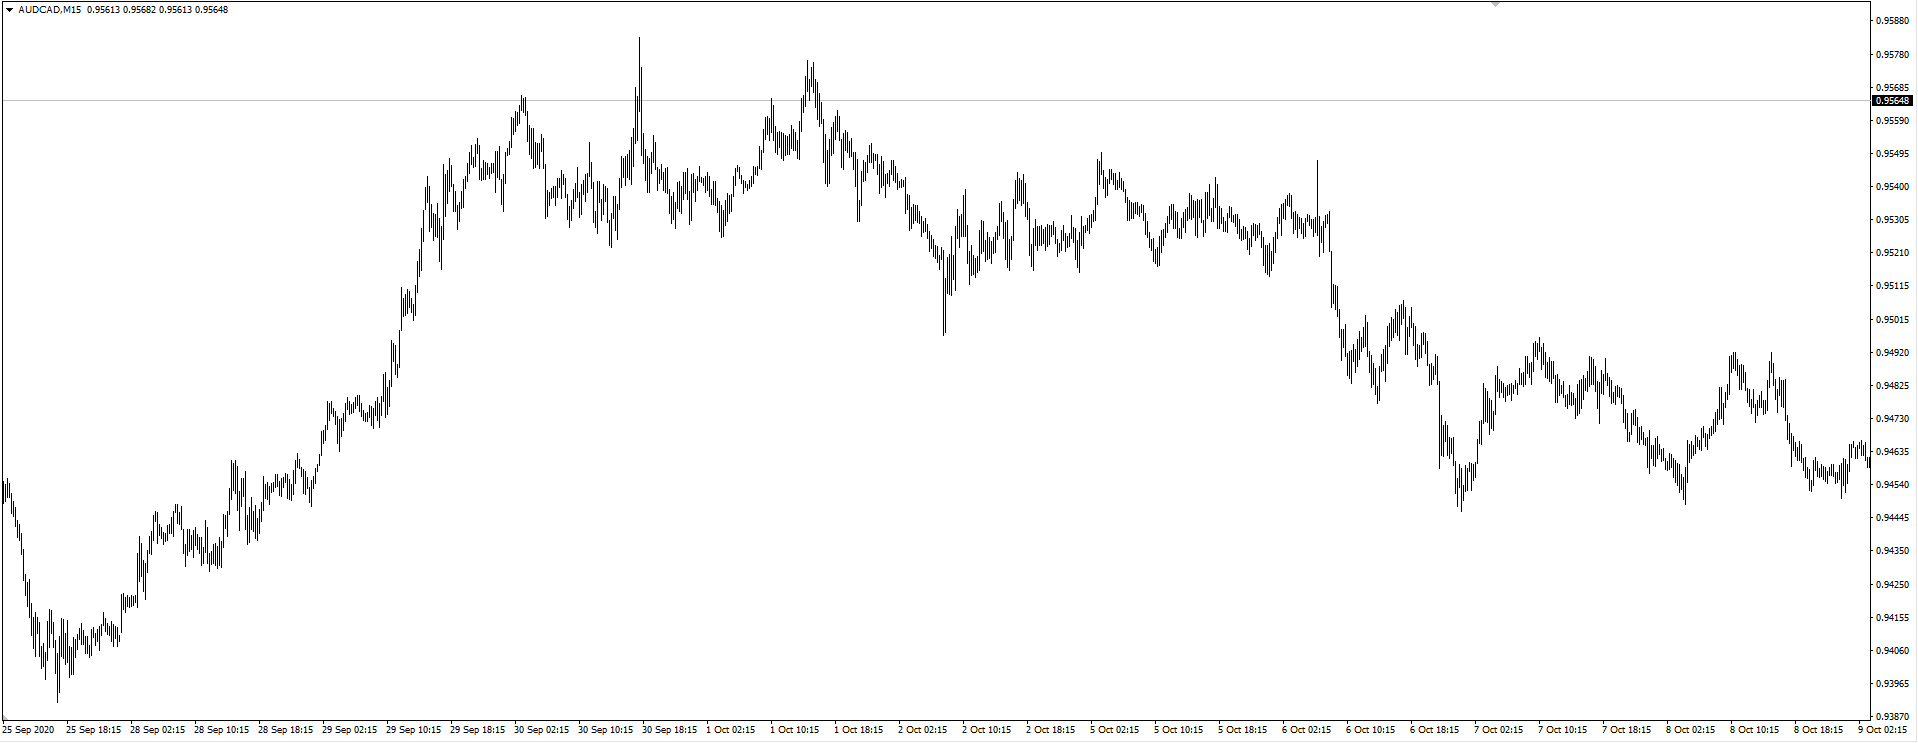
- Triple top / head and shoulders — a more elaborate reversal pattern with three peaks (or a center peak flanked by two smaller ones), likewise associated with a trend reversal at the top of a move.
Images
Comments (0)
- No comments yet.