Price swings
Price Swings
What is price swing?
Types of Swings
How to identify impulsive
and corrective swing?
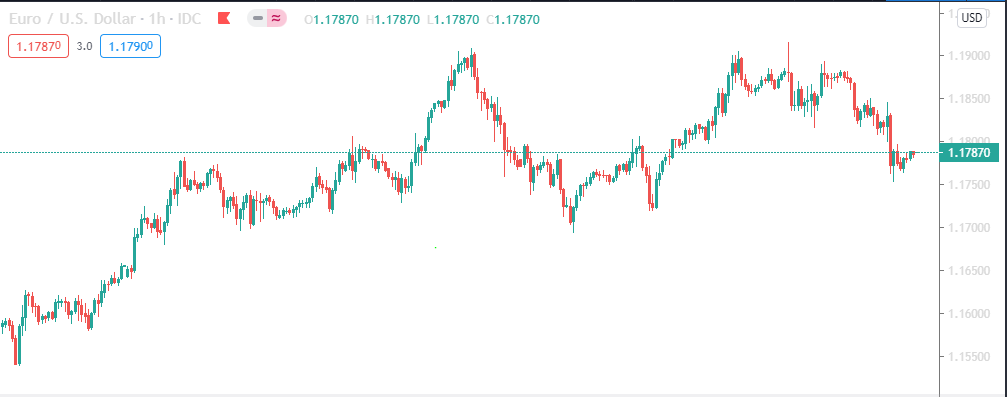
A price chart is a sequence of prices plotted over a
specific timeframe.
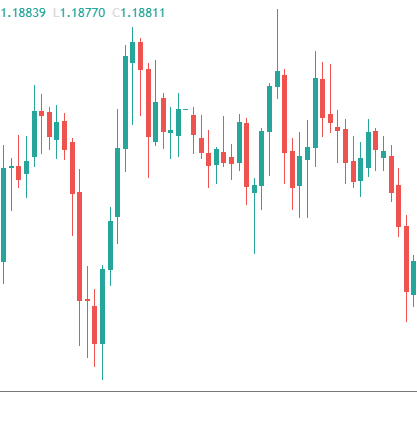
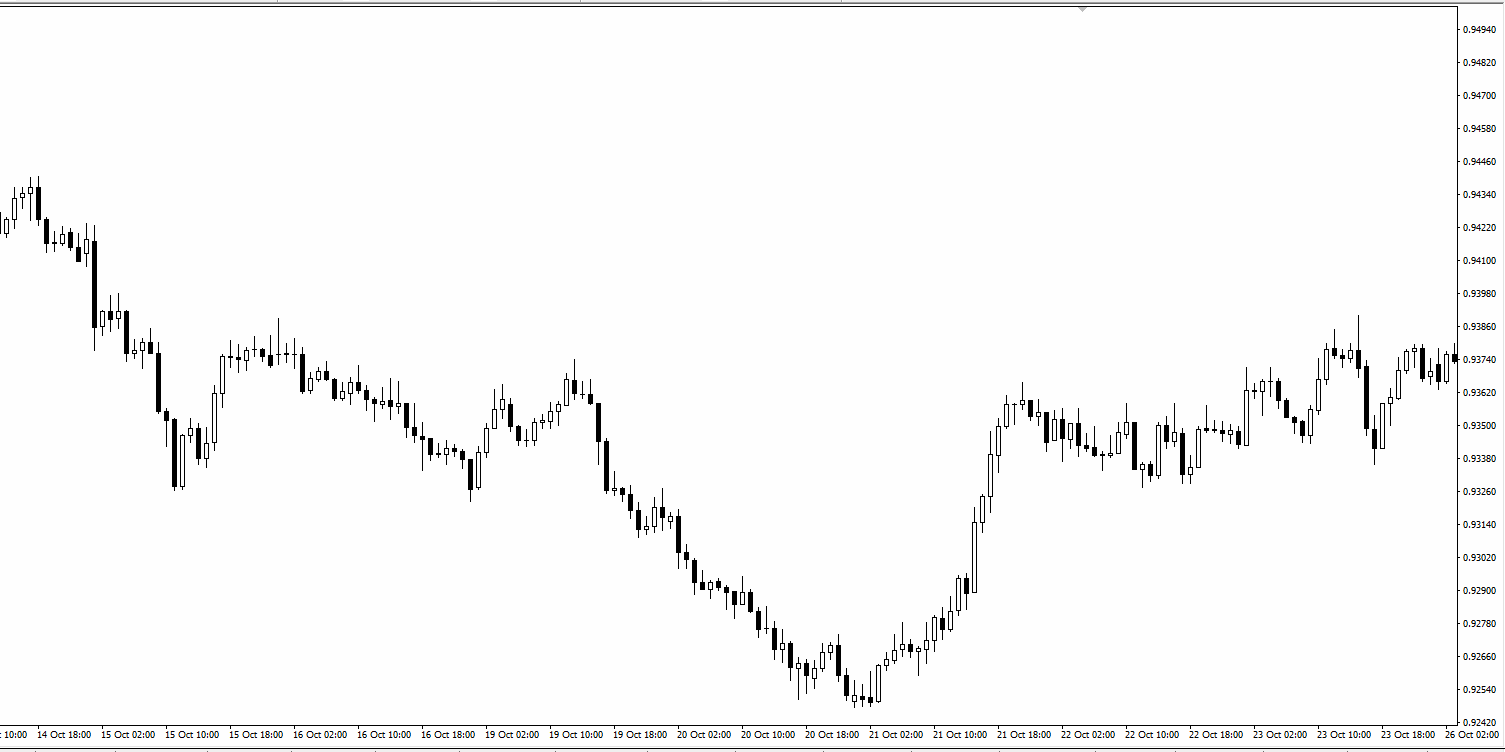
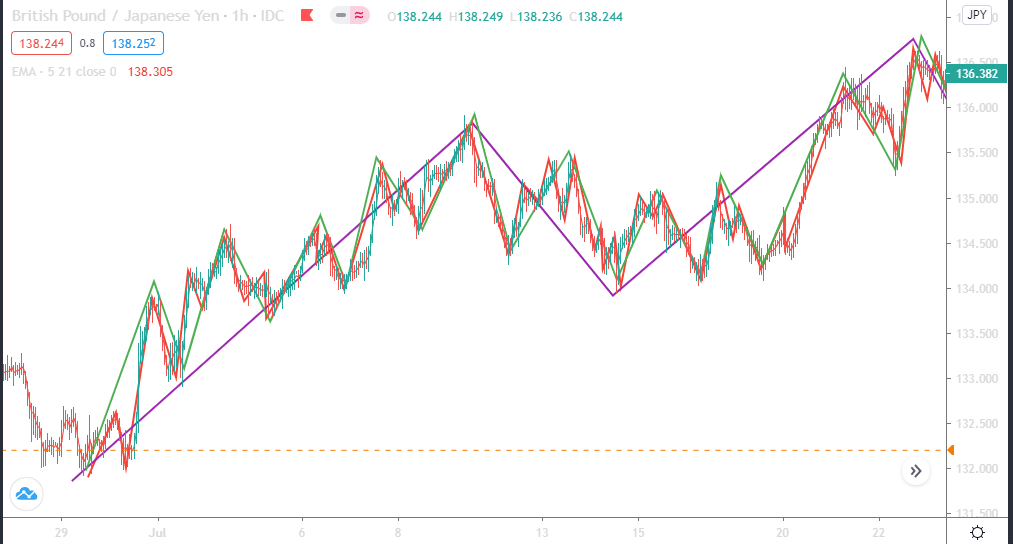
Price swings are formed on chart by group of candles
that share the same characteristics in direction and
strength.
What is a price swing?
Up Swing
(Bullish) Down Swing
(Bearish)
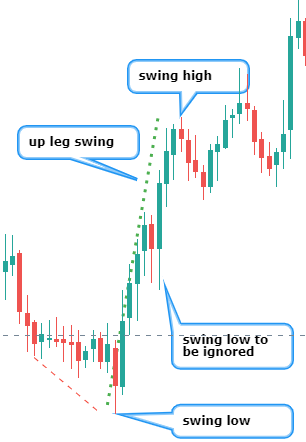
Swing High
Swing low
It takes one swing low and swing high to
make one swing leg.
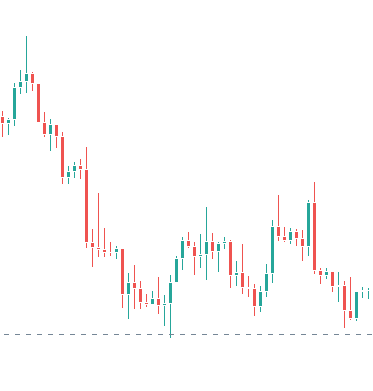
Impulsive swings
• Quick in one direction
(trending)
• Sharp with strong trend
candles. Usually subdivides
into 3 or 5 waves. Impulsive
wave can also be 1 single
wave.
How to identify impulsive
swings?
• In a down impulsive swing,
majority (at least 60%) of the
candles are bearish
• close near their lows.
• Sequence of candles are
lower highs and lower lows.
Impulsive - Quick move.
Price change in less time
Price
Time
Corrective - Slow move.
Price change taking
more time
Impulsive
T y p e s o f S w i n g s – Impulsive and corrective
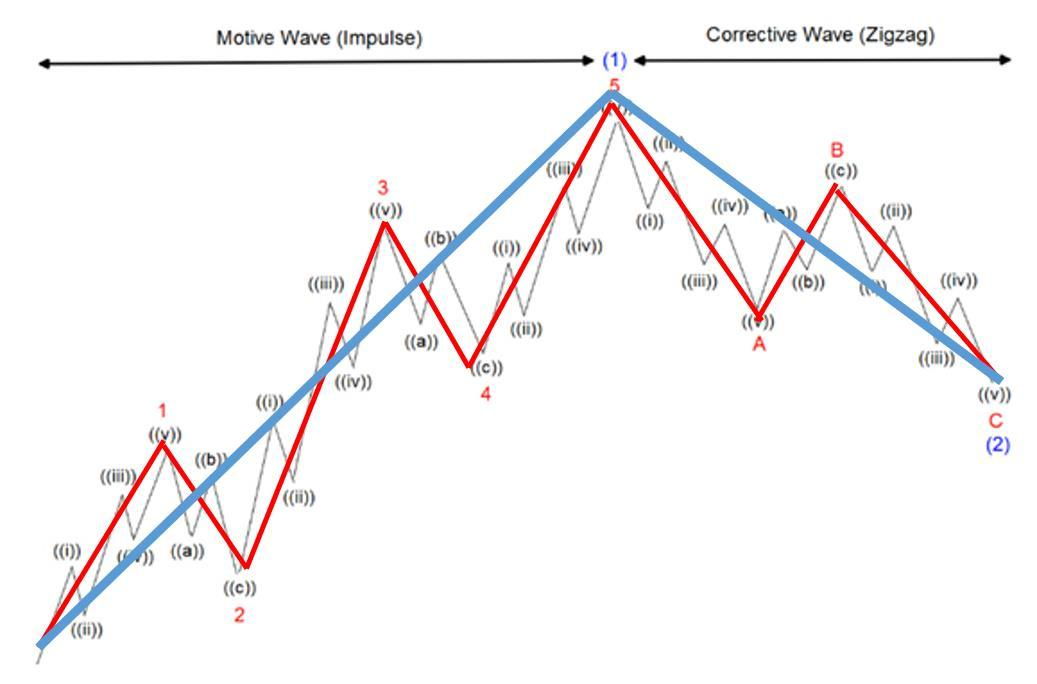
• Wave 2 should not go under wave 1
• Wave 3 should not be the shortest wave
• Wave 4 should not go to price territory of
wave 1
• Wave 2 and 4 should be similar in price and
time by at least 70%
More characteristics of impulsive waves
Types of Swings –Impulsive and corrective
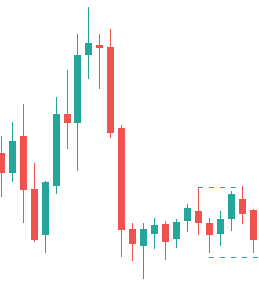
Corrective swings
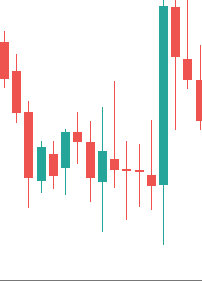
• Corrective swings are slow moving, indecisive and
sideways (showing both sides swings)
• They are both trending and non trending
• They are at least 3 waves
How to identify corrective swing?
• Candles are mixed (50-50): bullish, bearish, dojis.
• Most of candles close near the middle, lot of
indecision candles (dojis)
• No sequence of higher highs, higher lows or lower
highs lower lows
impulsive
corrective
• Smallest of swings in a chart
• Usually 2 candles to the left and 2 to the right
Swing high fractal
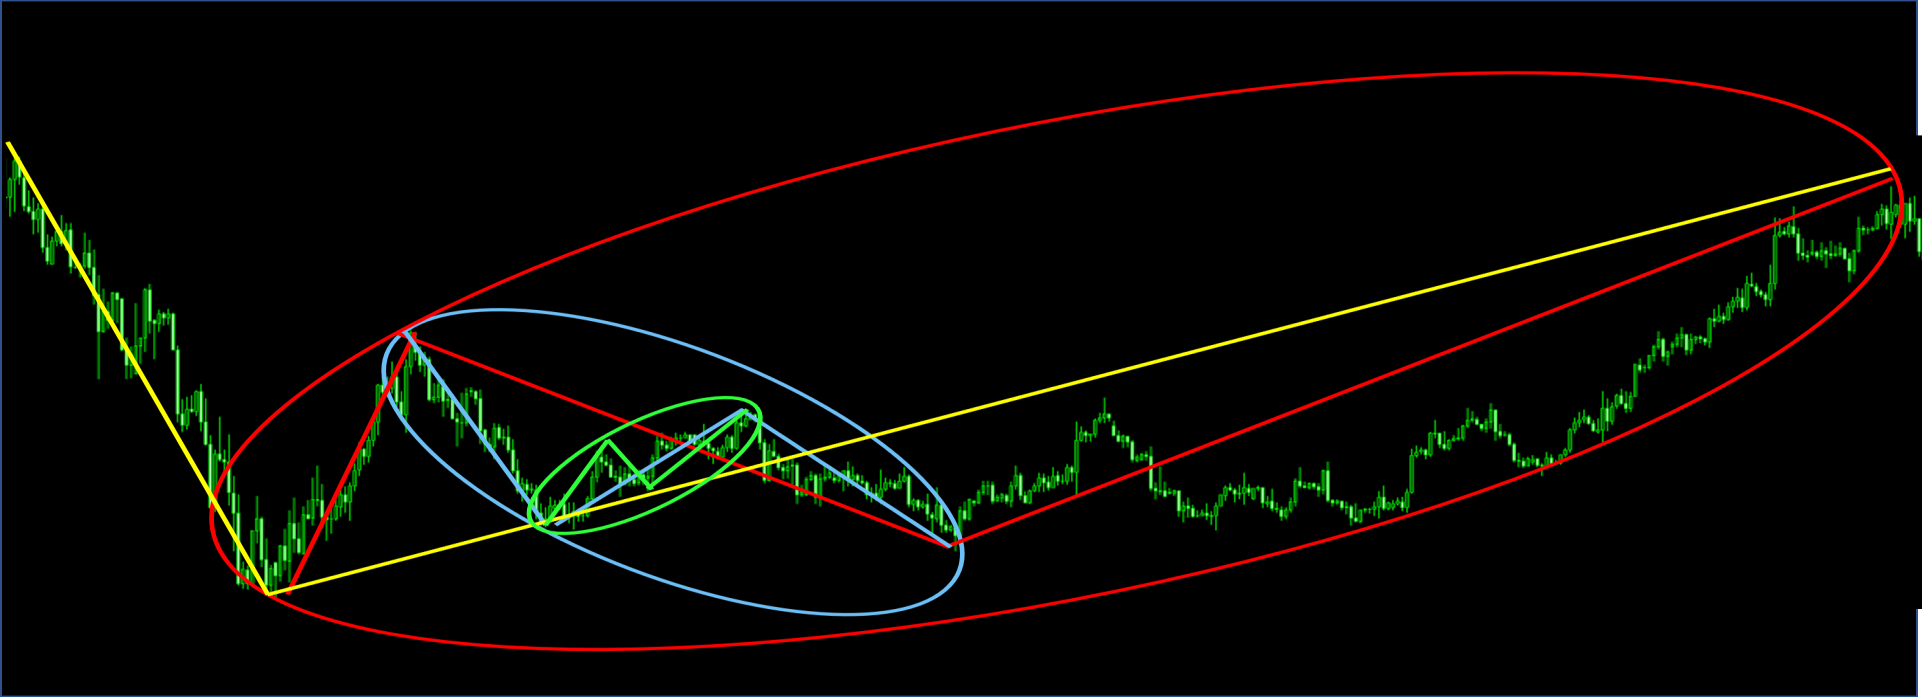
Fractals
A larger degree fractal will have smaller degree fractal inside it.
Fractals
Images


Comments (0)
- No comments yet.