What waves are
Open a price chart and squint at it long enough, and a shape starts to repeat: a run in one direction, a pause or pullback, another run, another pause. Wave analysis is the study of that shape — not as a curiosity, but as a record of how a crowd of traders actually behaves when it's making a collective decision under uncertainty, over and over, at every size of chart you look at.
Price is a crowd, not a number
A quote is the last price two parties agreed to trade at. That sounds mechanical, but the number itself is downstream of something much less mechanical: thousands of individual reads on the same information, aggregated into one line. Some of those participants are reacting to news, some to other traders' reactions, some to their own prior positions. Wave analysis treats the resulting price path as a psychological record — a way of watching a crowd's mood swing between optimism and doubt, expressed the only way a market can express anything: through price.
That's a modest claim, and it's worth being precise about what it isn't. It isn't a claim that markets are irrational, or that psychology can be reduced to a formula, or that the next move is predictable because the last one had a certain shape. It's a claim that price action has *structure* — that advances and declines tend to organize into a small number of recurring shapes, at a small number of recurring scales — and that recognizing the structure is a useful lens, not a crystal ball.
Trends move in five, corrections move in three
The two shapes underneath almost everything in wave analysis are simple. A move that extends a trend tends to break into five smaller swings. A move that interrupts or corrects a trend tends to break into three smaller swings. Trace either one on a chart and you'll usually find the smaller shape repeating inside the larger one — three swings inside a bigger three, five swings inside a bigger five — which is what gives wave reading its characteristic fractal look. Lesson 2 goes into the five-and-three distinction properly; for now, the point is just that the crowd's behavior tends to organize itself, and that organization is what a wave count is trying to describe.
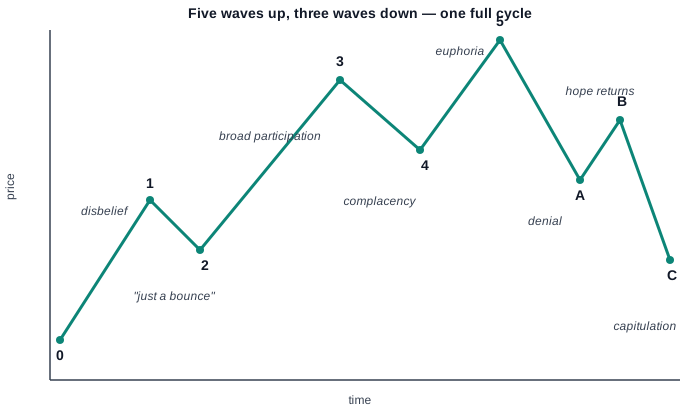
Look at the labels under the diagram above rather than the shape alone. Wave 1 happens while most of the crowd still doubts the move — it's read as a bounce, or noise, or a trap. Wave 3 is usually the stage where doubt breaks and participation widens; it's typically the longest, strongest leg, because it's the one point where disbelief and conviction are both pushing the same direction at once. Wave 5 often runs on narrower participation and thinner conviction than wave 3 did, even as price makes new highs — a gap between price and the crowd's underlying confidence that the wave count is built to notice. Then the correction unwinds some of that move against a backdrop of denial, a partial recovery of hope in wave B, and a capitulation into wave C.
None of that is a schedule. It's a *description of a tendency* — the psychological reading is diagnostic, not predictive on its own, and it earns its keep only when it's paired with the structural rules covered later in this module.
Why this matters for reading a chart, not just theorizing about one
The practical reason to think in these terms is that it reframes the question a chart puts in front of you. Instead of asking "will price go up or down from here," which invites a guess, wave reading asks "what stage of a repeating human pattern does this look like, and what would tell me I'm wrong about that." The second question is answerable in a way the first one isn't — it points you toward specific levels and specific structural checks, rather than a hunch.
That reframing is also why every lesson in this module keeps returning to one question: what would invalidate this read? A wave count isn't a belief to defend — it's a hypothesis about which stage of the crowd's cycle price is currently in, and like any hypothesis, it's only useful if there's a clearly stated way for the market to prove it wrong. If a count can't be invalidated by anything, it isn't really a count; it's a story.
What this lesson is not claiming
Two things worth being explicit about early. First, wave structure is a way of describing price behavior after the fact and forming a testable read going forward — it does not remove uncertainty, and multiple readings of the same chart can be reasonable at once until price clarifies which one survives. Second, nothing here is a signal to act on; it's a vocabulary for describing what a chart is doing and why, which is the same vocabulary the rest of this module — and CAT's own analyses — use to make a wave-based read legible and checkable rather than a black box.
The next lesson takes the five-versus-three distinction introduced above and makes it precise: what actually separates a motive move from a corrective one, and why the difference matters more than which direction price is heading.
Comments (0)
- No comments yet.