Strategies with Entry & Exits
Strategies
1. Higher time frame and lower time frame candle entry strategy
2. Triple top and Triple bottom
3. Candle stick pattern entry
4. Fib level entry
5. High probability set ups
1. Higher time frame and lower time frame candle entry strategy
Buy signals
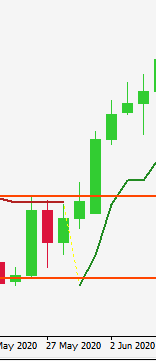
1. Know your weekly support and resistance areas
2. Bull candle engulfing or piercing or a strong bull bodied candle on Daily time frame
3. Mark the daily candle high and low with horizontal line visible in H1 time frame
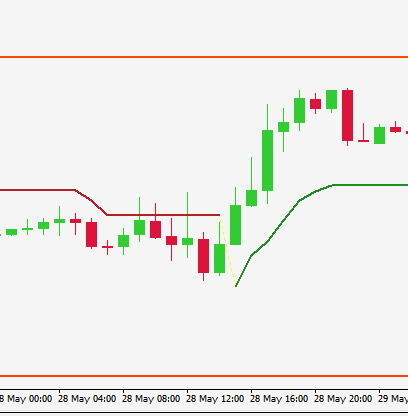
4. Look for buy trigger on H1 within the horizontal lines zone
5. Trigger: H1 bull candle having higher high and higher low than its previous candle, super trend indicator in green color.
6. Enter at break of high of the H1 bull candle.
7. Put stop loss at the low of the H1 entry candle.
8. Daily candle should not come at a weekly resistance
9. Target 1:3 risk reward, set stop loss at breakeven upon 1:1
N.B: use the supertrend indicator
Daily candle 2
Daily candle zone 3
H1 bull candle within
daily zone with super
trend green
4 5
Daily candle zone
Daily time frame
1 hour time frame
1. Higher time frame and lower time frame candle entry strategy
Sell signal
1. Know your weekly support and resistance areas
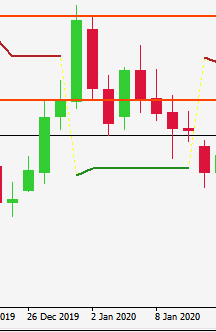
2. Bear candle engulfing or piercing or a strong bear bodied candle on Daily time frame
3. Mark the daily candle high and low with horizontal line visible in H1 time frame
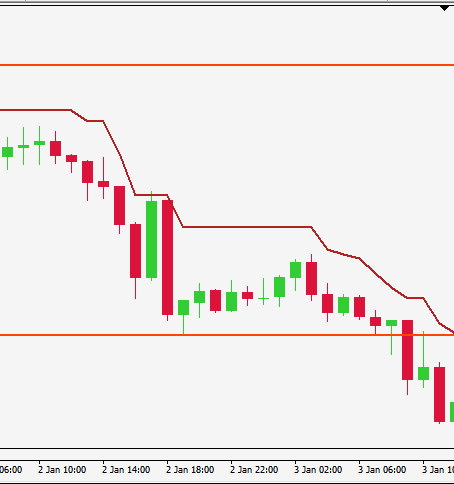
4. Look for sell trigger on H1 within the horizontal lines zone
5. Trigger: H1 bear candle having lower high and lower low than its previous candle, super trend indicator in red color.
6. Enter at break of low of the H1 bear candle.
7. Put stop loss at the high of the H1 entry candle.
8. Daily candle should not come at a weekly resistance
9. Target 1:3 risk reward, set stop loss at breakeven upon 1:1
N.B: use the supertrend indicator
Daily candle 2
Daily candle zone
Daily time frame
1 hour time frame
Daily candle zone
H1 bear candle within
daily zone with super
trend red
4 5
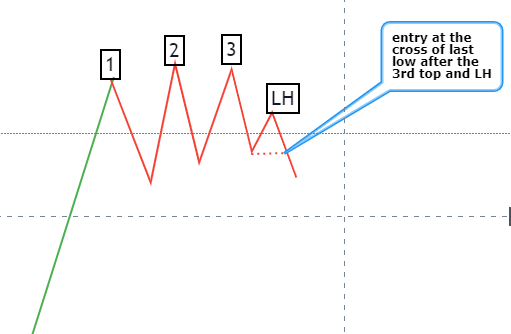
2. Triple top
LH
Entry at the break
of last low after LH
• Stop loss is above the LH
• Take profit 1:1 or 1:2
1:1
1:2
Stop loss
2. Triple bottom
Entry buy at break
of last H after HL
HL
HL
• Stop loss is above the LH
• Take profit 1:1 or 1:2
3. Candle stick pattern entry
Bearish
engulfing
Bullish
engulfing
1. After top down analysis look for candlestick pattern at entry level
2. If structure belong to h4, look for engulfing candlestick pattern on H1.
3. Take profit 1:1 or 1:2
Stop loss 1 pip above
the engulfing candle
Entry (1 pip below
the engulfing
candle)
Engulfing pattern
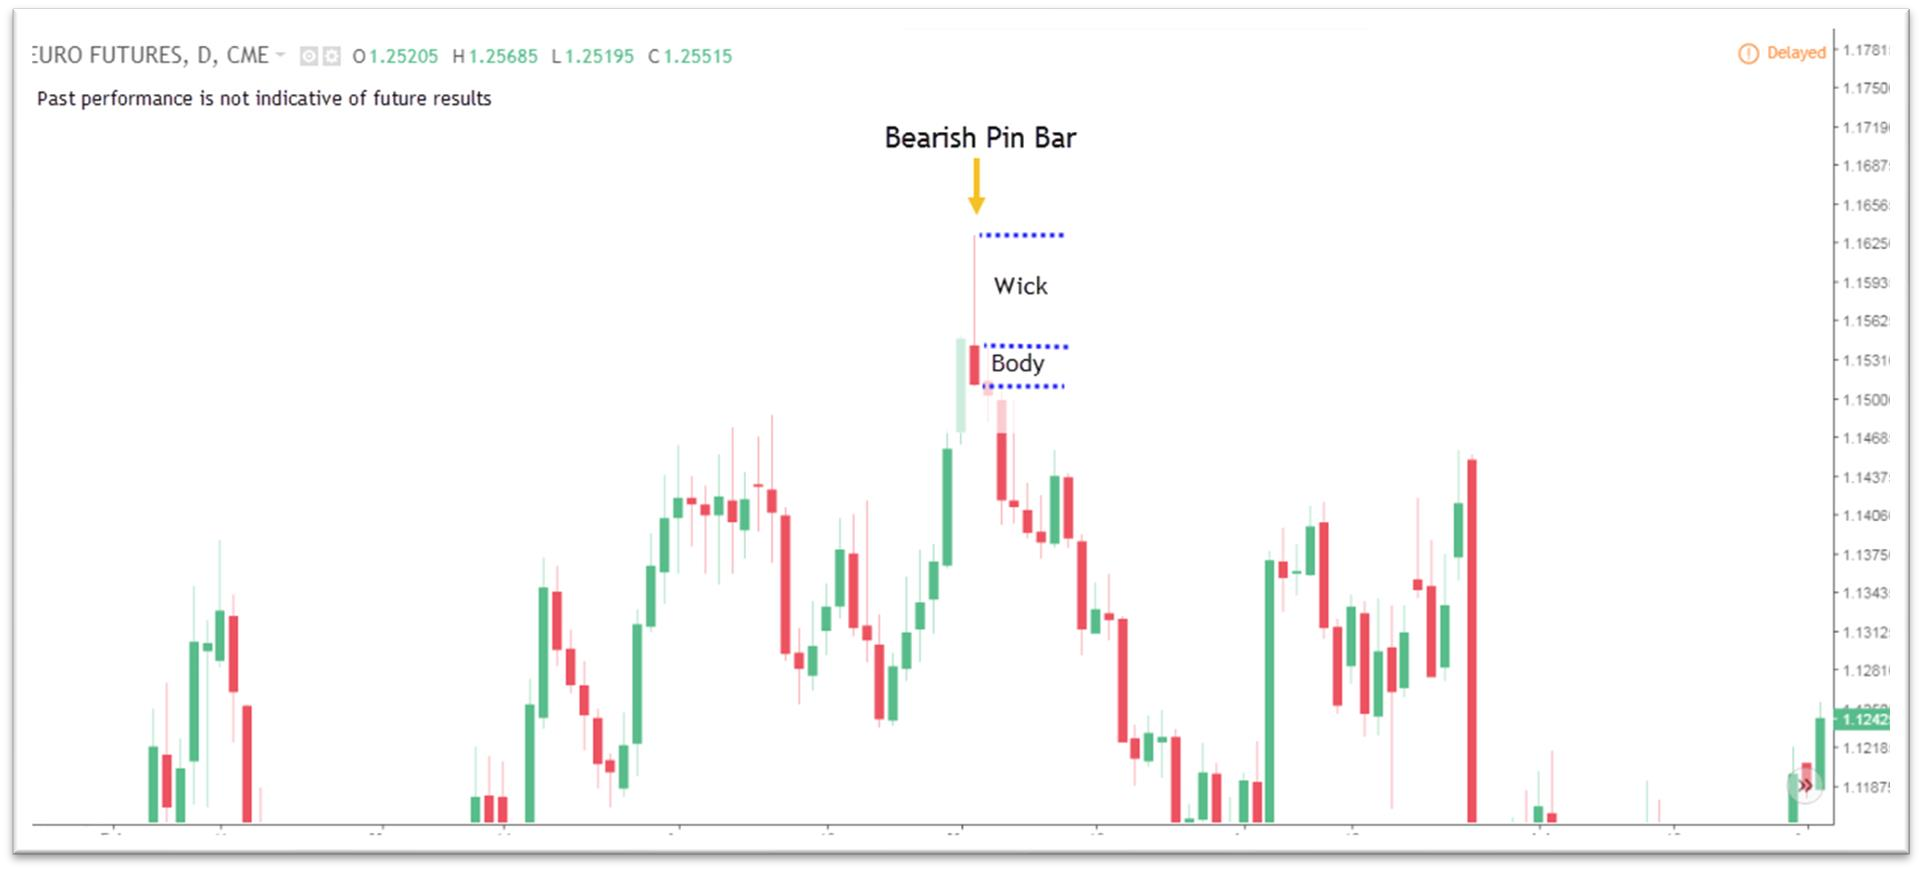
Bearish
pin bar
Pin bar pattern
• Comprises of two segments, the “wick” portion and the “body” of the candlestick. Ideally, we want the body to
be small relative to the size of the wick by almost 3 times.
• The height of the whole of the pin bar candlestick should be more than the height of its previous candle
• Entry: if the structure belongs to H4 look for pin bar in the same time.
Bullish
pin bar
Stop loss 1 pip
above the pin bar
candle
Entry (1 pip below
the pin bar
candle)
3. Candle stick pattern entry
MT4 Trading Terminal 4. Fib level entry
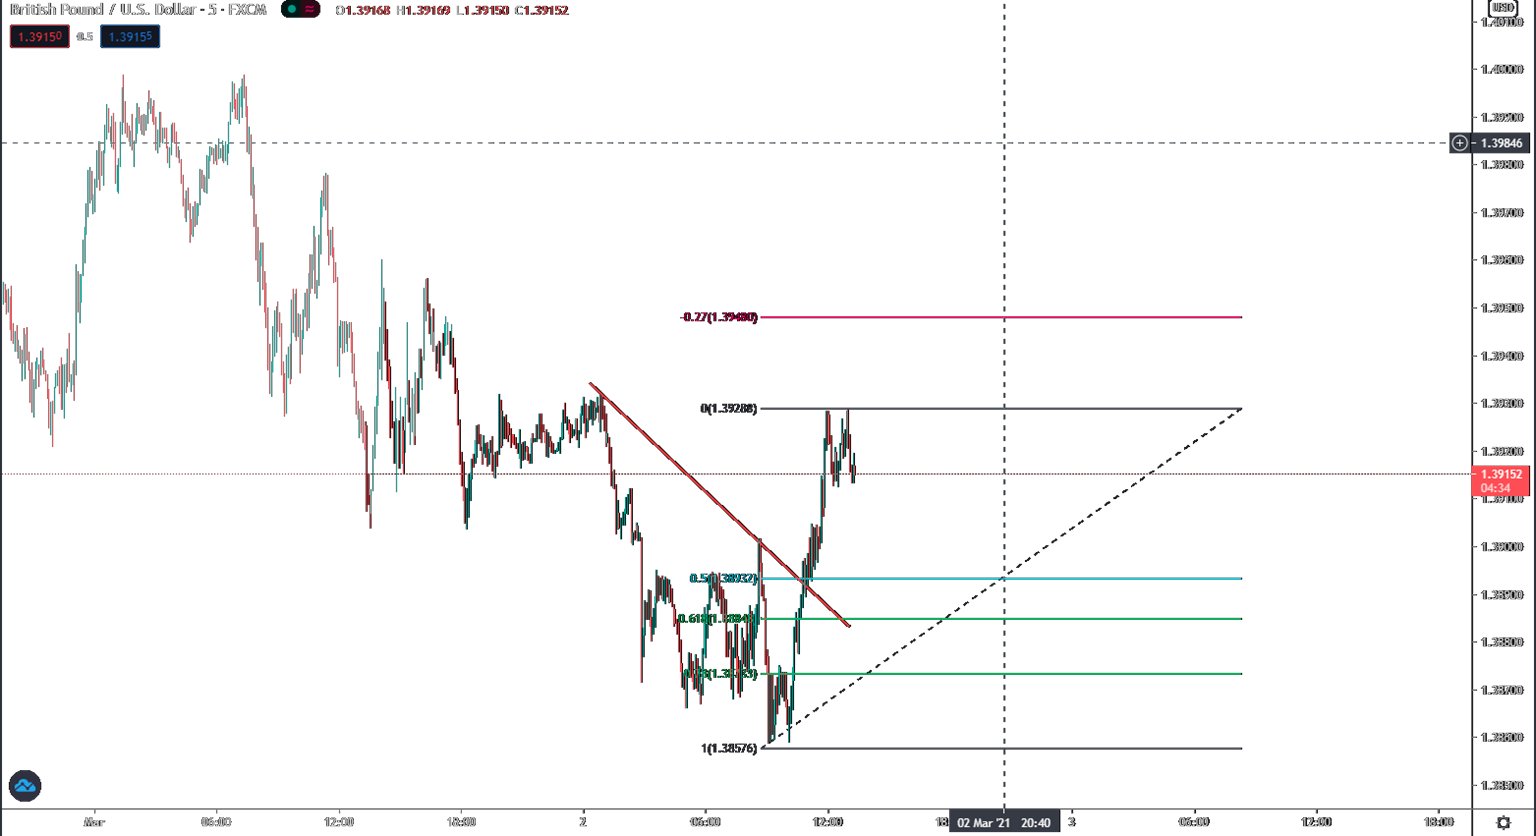
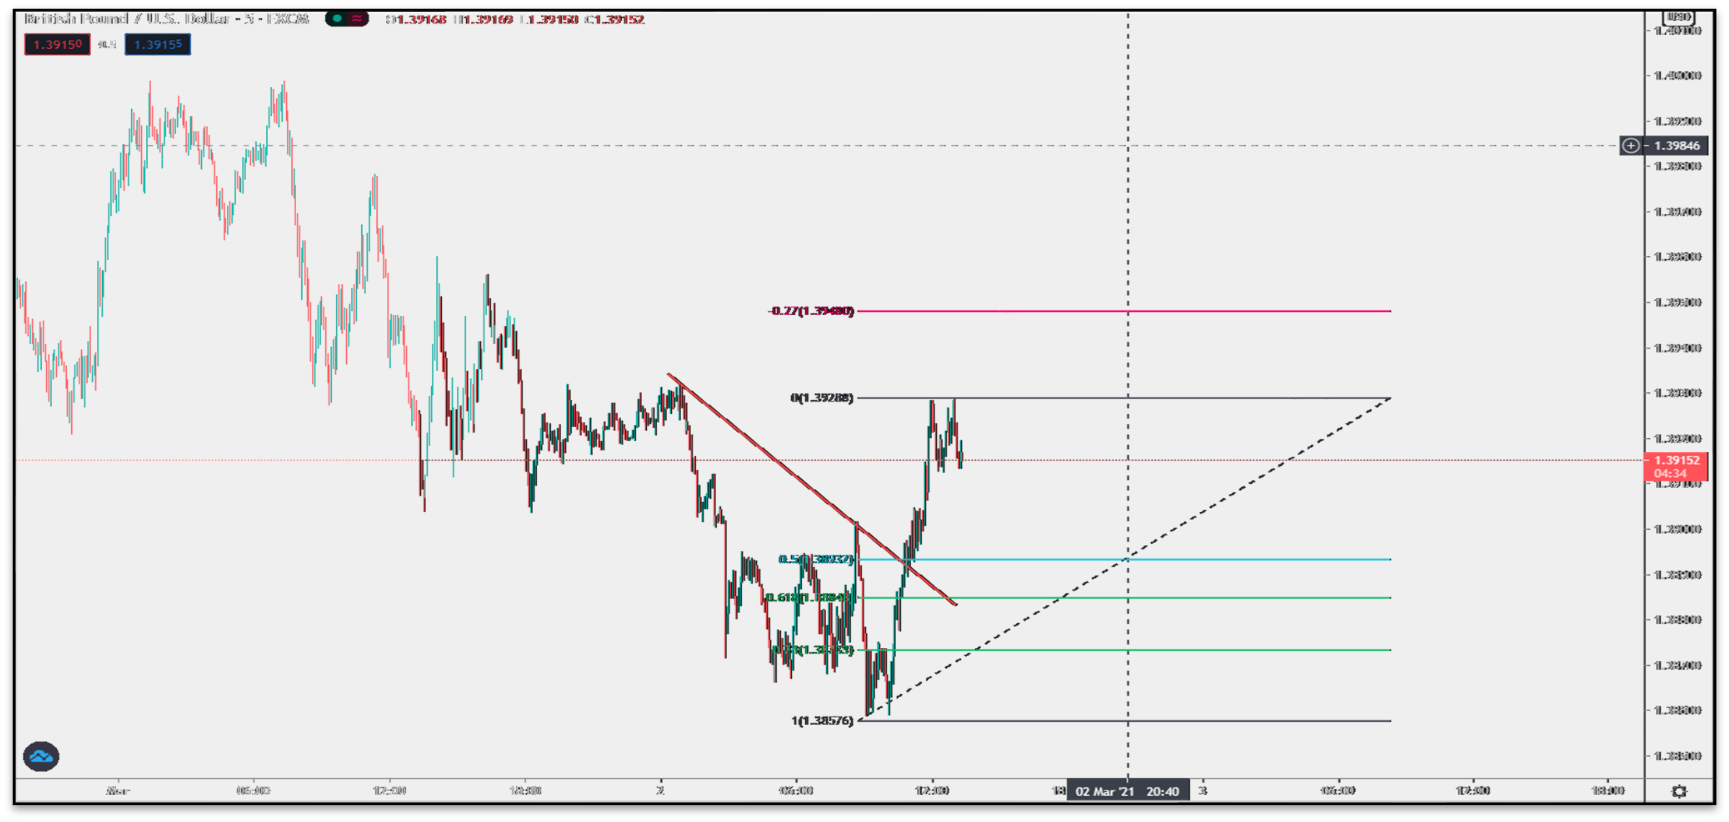
• Mark the 61% and 78% levels of the 1st impulse on entry time frame after top down analysis.
• Apply strategy 4 on H1 once the price reaches any of these fib level.
Or
Enter at the fib level price
• Stop loss is 1 pip below start of the impulsive wave that is fibbed in case of buy entry and 1 pip above the start of the
impulsive wave in case of sell entry.
Buy entry
Corrective
pattern
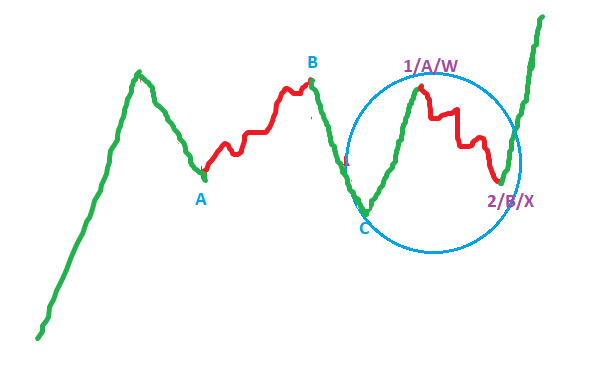
5. High Probability set up
correction within correction
Smaller degree impulse correction
set up found inside big impulsive
wave after 3 wave correction (blue
ABC)
Big impulsive wave
Fib this impulse and enter
with A/B/C strategy.
Fib this impulse and
enter with A/B/C
strategy.
Fib this impulse and enter
with A/B/C strategy.
FullSupportto trade
profitablyand find
investorfunds
Go Pro
Regular Q &A Live
Trading Sessions
Generate 0.5% - 1% a day
Find Investors and grow
your portfolio
Learn Business and Trade
Automation
Sign up at
www.silverpips.com/gopro
6. Trading Break Outs
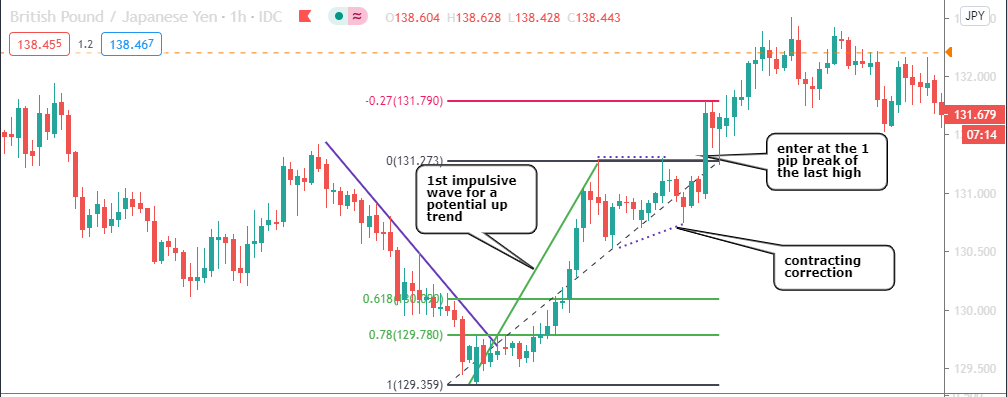
1. Entryismade when the nextimpulse,preceded by a correction of the 1stImpulse,crossesthe end of the 1stimpulse.
2. Breakout entryisdone ifyou are expecting reversalof the ongoing trend or correction of a bigger degree or when you
do not get an entry as per strategyno. 4 (price didn’t go to the expected fib level).
6. Trading Break Outs
1. Another demonstration of Break out entry. Stop loss can be 1 or 2 as show below depending upon your profit target.
2. Stop loss can be 1 or 2 as show below depending upon your profit target.
Corrective
pattern.
Stop loss1
Stop loss 2
Stop loss 2
Buy at the break of
last high
FullSupportto trade
profitablyand find
investorfunds
• Profit levels can be technical and non technical unlike stop loss level that needs to be technical.
• Non technical : as per risk reward
• Technical : for a bigger degree structure with entry set up on h1, profit target can 1:3/4 . Or until the time there is
trendline line break and last swing low/high break on h1.
• Trailing stop loss to breakeven for a bigger degree structure entry.
• Scaling out : you can think of adding one more trade while your first one is running and stop loss is put to breakeven so
that the risk on new trade is same as the risk you took earlier for the first trade and now your overall risk is same as you took
for first trade but you have two trade so your risk : reward becomes 1:4 if it was 1:2 earlier
Take Profit
Images











Comments (0)
- No comments yet.