Top down analysis
Top Down Analysis
Top Down Analysis
1. Label all charts starting from monthly till H1. Label full chart of monthly, then label only the last leg of monthly on weekl y,
label last leg of weekly on daily, last leg of daily on h4 and last leg of h4 on h1/15 mins .
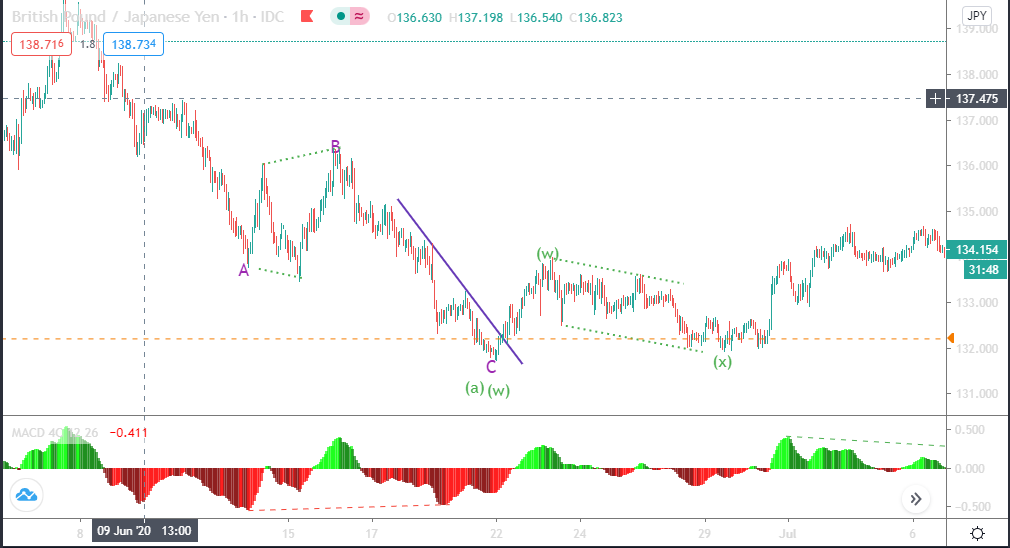
2. Check for divergences between last two impulses on all time frames
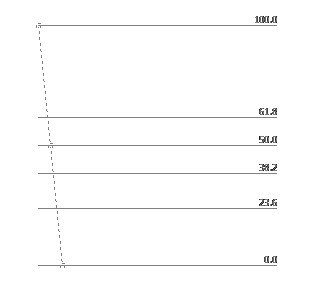
3. Fib the latest impulsive wave, in these time frames, if the impulse is the potential wave 1 or wave 3.
4. Count the corrective waves when it forms after the wave you just fibbed . Corrective waves should be at least 3 waves,
if yes then
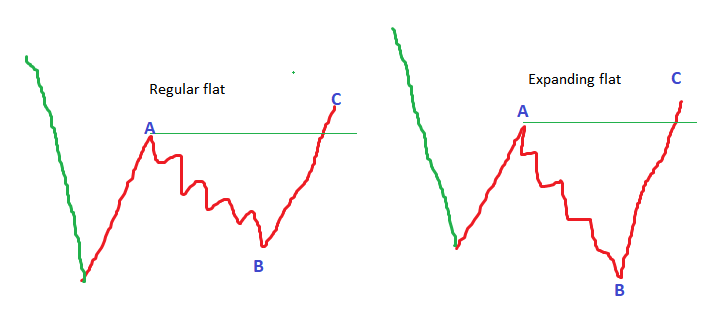
5. Check for the completion of corrective structure – for regular flat, zigzag and expanding flat the structure completes
when wave C crosses the end of wave A. In the picture below the structure is completed when the green line is
broken.
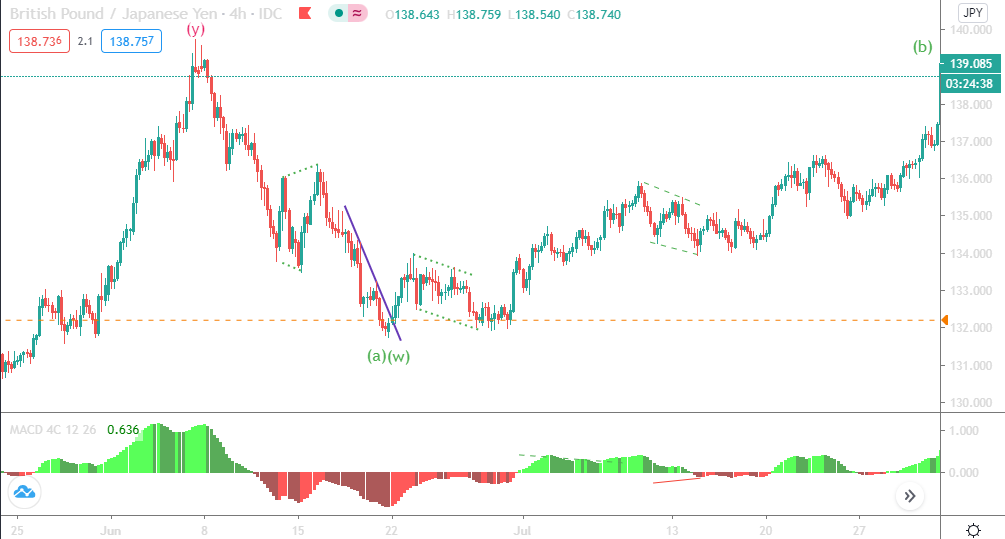
6. After you see structure completion, note the time frame to which the structure belongs - how to know this ?
The structure belongs to the highest time frame on which you see the same structure you are tracking.
Trendline
broken
Last fractal of
lowest degree in
this chart
Divergence
Top Down Analysis
8. Set ups are to be found in lower time frame, 15 minutes or 1 hour time frame.
Higher time frame
Lower time frame
Top Down Analysis
(4)
(3)
(4)
After labeling your waves, if the current wave is corrective
(wave 2 or wave 4 ), label the corrective wave to see if it’s a
zigzag or any other corrective pattern and if it is in the last leg of
the corrective pattern like leg C in red in the figure below.
If this C is on H4 or
higher time frame, go to
a lower time frame to
analyze completion of
this wave
Label subwaves of
wave C.
7. When the last wave of corrective pattern reaches the fib level you are waiting for
(as per the fib ratio given in the table in the Fibonacci lesson), move to the lower time
frame .
10. Fib the impulse down and wait for corrective pattern to complete or touch the
expected fib level 61% or 38%.
Lower time frame
Top Down Analysis
9. Wait for a new impulse down which goes below the last swing low on the same time
frame
(4)
Fib the first new
impulse down.
0.0
100.0
Last swing low
first new impulse down.
61.8
(4)
Corrective
pattern.
0.0
100.
Sell entry here (strategy
no. 4). You can apply
other strategies too as
shown in the strategies
section
61.8
In the next lesson you will learn how to find trade set ups after the Top down Analysis
Images



Comments (0)
- No comments yet.